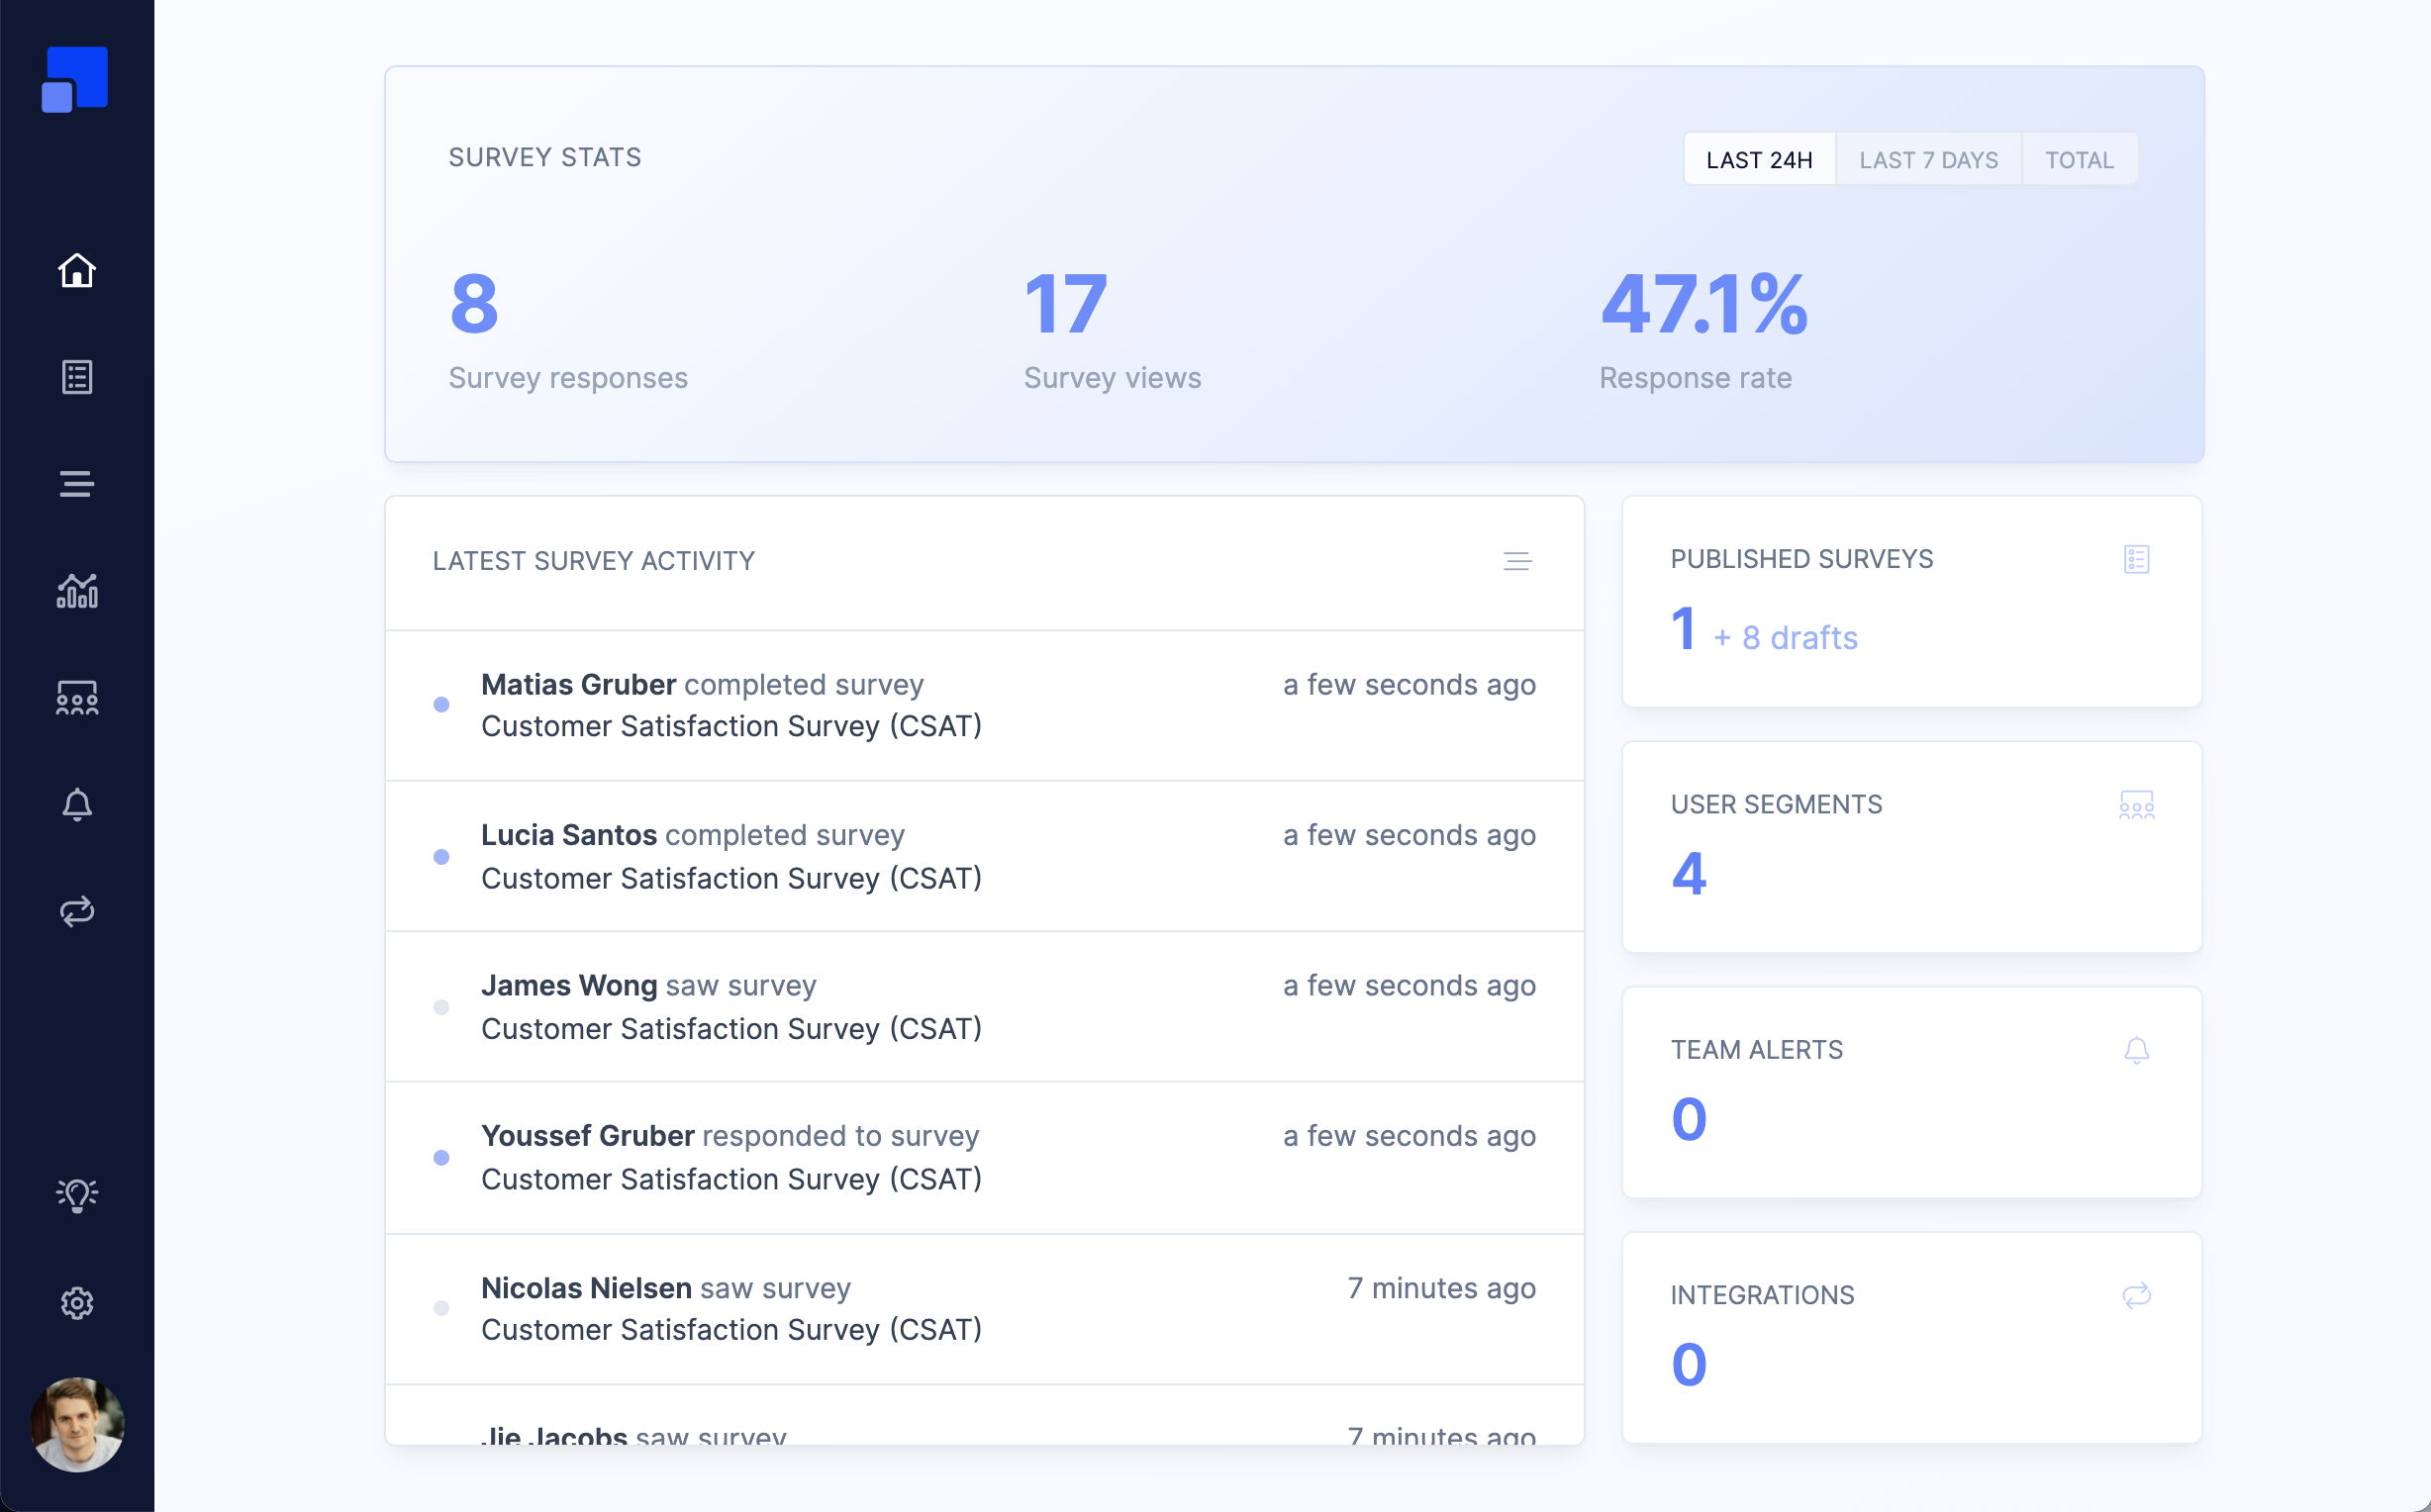
With the release of our new data analysis dashboards, we also introduced a new project overview page. Right after logging in to your account, you’ll be greeted with the most important stats and recent survey activity.

The overview pages includes a top panel showing the number of survey views, survey responses and the resulting response rate. You can set the time frame for those stats to last 24 hours, last 7 days or all time.
Below the top panel, a list with all recent survey interactions is located. The list shows survey responses, as well as survey views. Clicking on a survey interaction will reveal our new User Detail Panel where you’ll find all data we have on record for a given user.
Nex to the latest survey interactions, you’ll find a quick overview of your project setup.