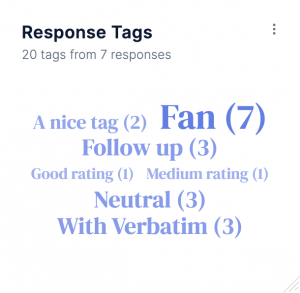
You can now visualize how you and your team were tagging survey responses with our new “Tag Overview”.
The new chart type supports two visualization options. By default, tags are displayed in a Tag Cloud:
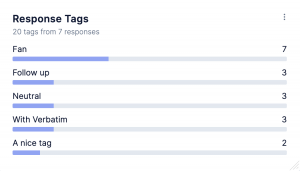
As an alternative to the Tag Cloud, you can also choose to display tagging information in a list view. Either sorted by label or by value.
Like all other charts, you can choose which data gets included in the visualization. You can choose specific survey questions, and filter responses by segments, surveys and tags.