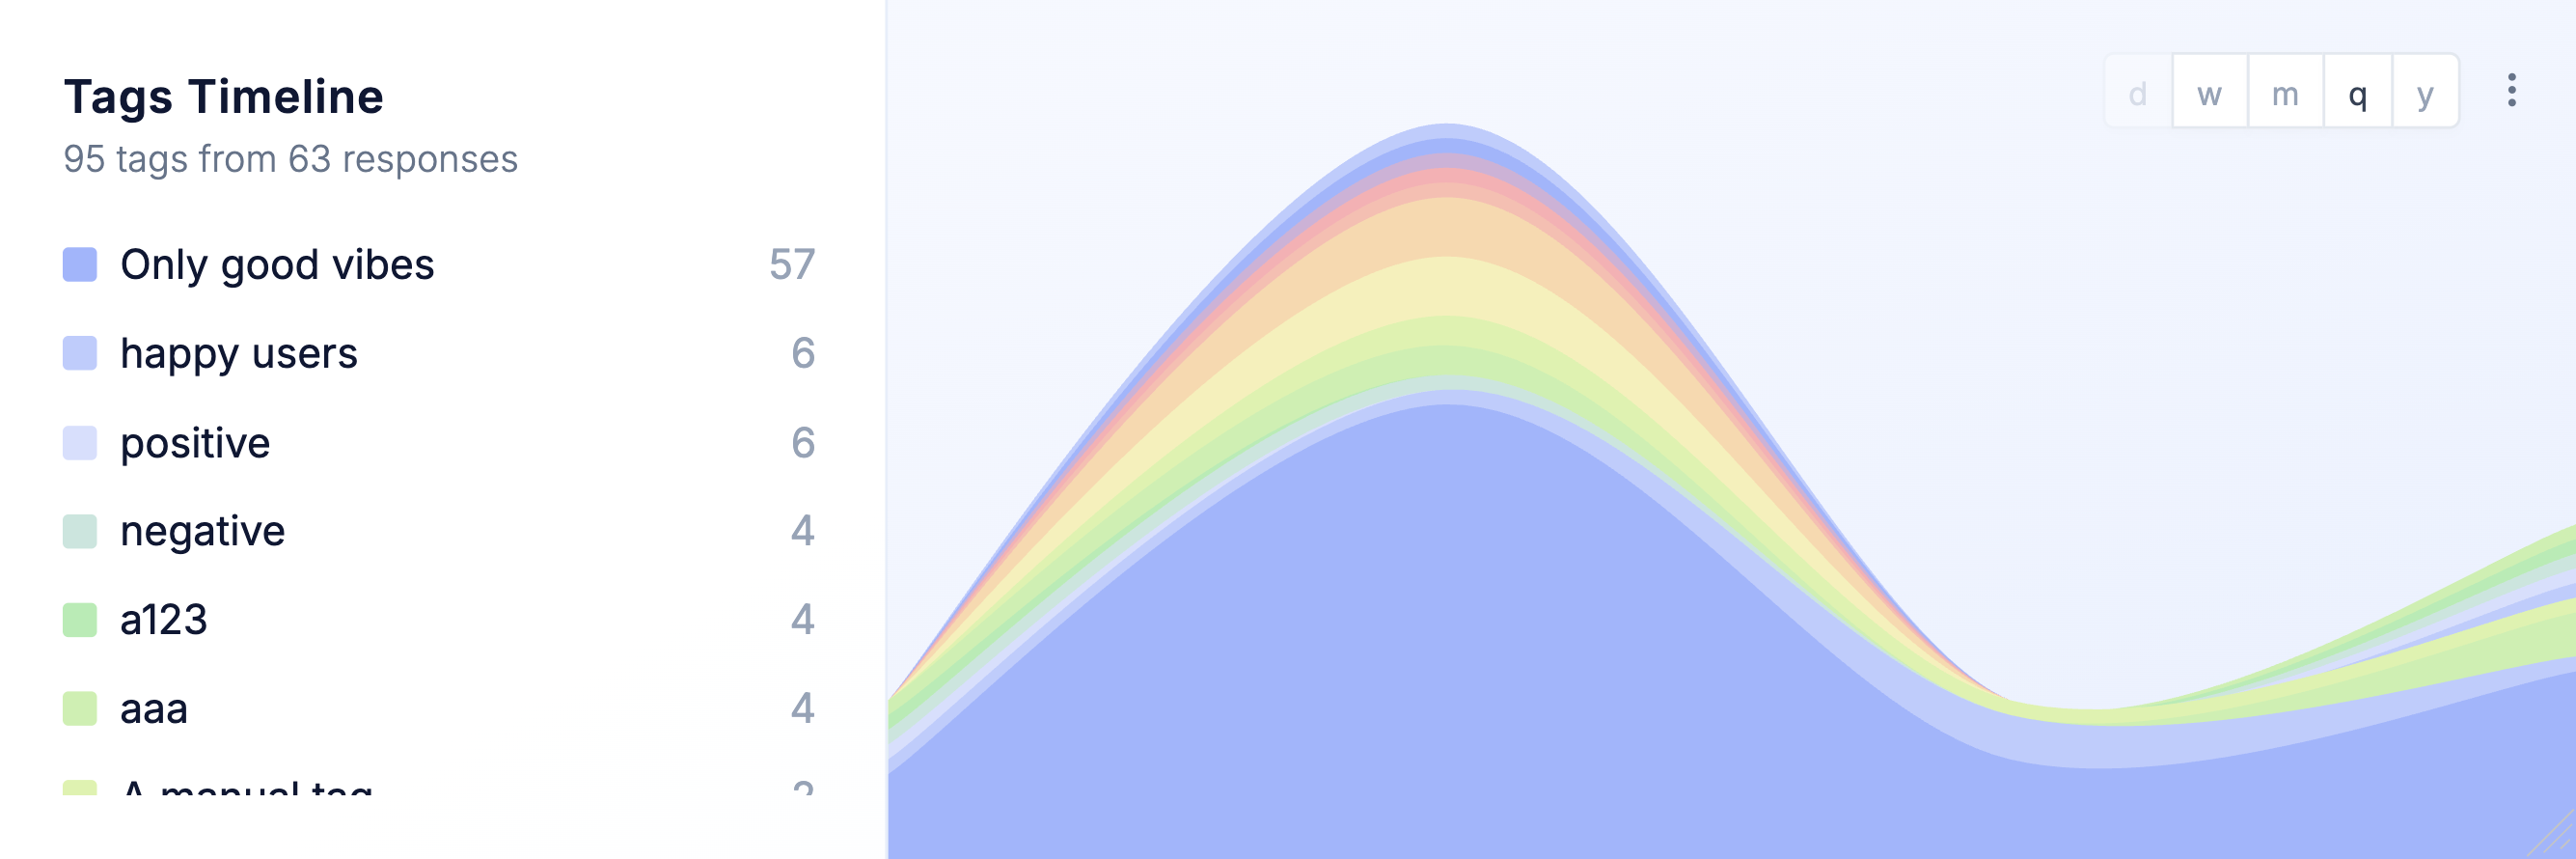
You can now visualize how customer feedback trends over time with the Tags Timeline chart.
This new chart shows how often a specific response tag is used across survey responses, plotted over time. It makes it easy to spot emerging themes, recurring issues, and the impact of product or process changes.