We’re excited to announce a significant update to our reporting dashboards, designed to make exploring and analyzing your survey data more intuitive and efficient.
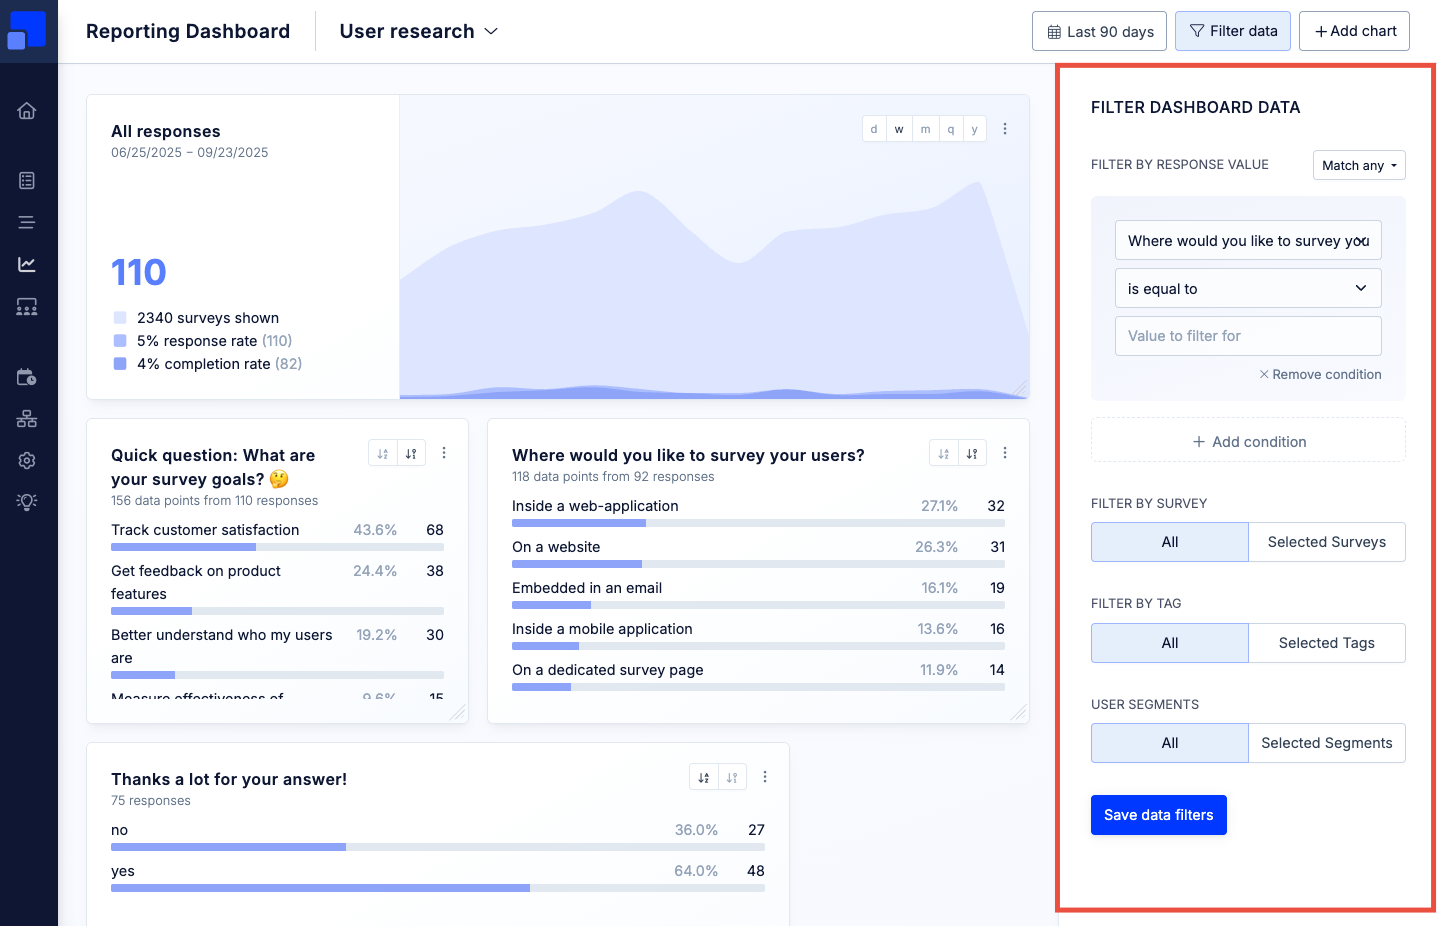
With this release, you can now filter the data displayed across all charts within a dashboard in just a few clicks. At the top of the dashboard, you’ll find a new “Filter data” button in the navigation bar. Clicking this button opens a familiar filter sidebar – the same one you already know from the Survey Response List. This sidebar lets you refine your dashboard view by survey response values, specific surveys, segments, and tags, giving you a powerful way to focus on exactly the data you care about.
For those who need even more granular control, chart-level filters are still available. As before, you can open Edit Chart and activate “Override Filters” to set individual filters for a specific chart. When enabled, you’ll see the same filtering options you’ve been using up until now, ensuring a seamless transition and full flexibility.
This upgrade brings a more streamlined and flexible reporting experience, helping you uncover insights faster and with less effort.