Introduction
Refiner includes fully customizable dashboards that help you analyze survey response data.
You can create an Ad-hoc Dashboard for a specific survey with just one click, or build Custom Dashboards that combine data from multiple surveys.
You have full control over which survey data appears on each dashboard. Create multiple dashboards for yourself and your team, then customize them to match your reporting and analysis needs.
Frequently Asked Questions
Can I create multiple dashboards?
Yes. You can create multiple dashboards to view your survey data in different ways.
For example, use the filter sidebar or individual chart filters to narrow down the data shown on each dashboard. Once saved, each dashboard gives you one-click access to a specific view of your survey data.
Which chart types are available?
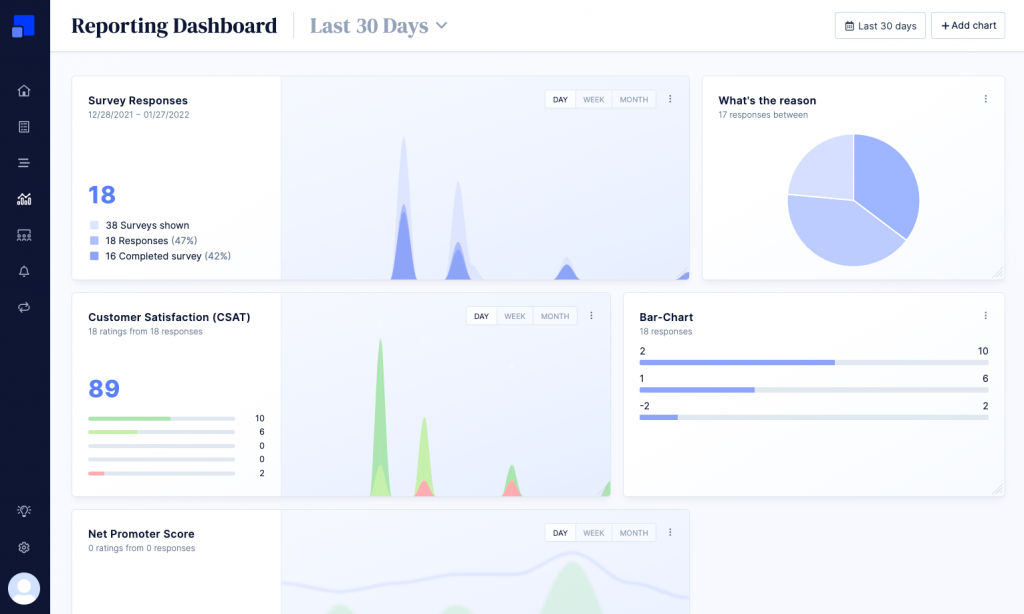
The following chart types are currently available:
- Bar-Chart
- CSAT Timeline Chart
- Distribution Trend
- Net Promoter Score Chart
- Pie-Chart
- Ratings Timeline
- Responses List
- Responses Overview
- Tag Overview
- Tags Timeline
Can I display contact traits or user profile data on a dashboard?
Dashboards can visualize response data from one or more surveys. Data stored on user profiles, such as contact traits, cannot be visualized in dashboards. You can however use contact traits to filter and narrow down the visualized data.
Can dashboards be shared with my team?
Yes. All dashboards saved in your account are automatically visible to all team members who have access to the same Refiner environment.
Can dashboards be shared with people outside my Refiner account?
Yes. Dashboards can be shared with people who do not have access to your Refiner account. You can also embed dashboards on a website.
What is the difference between an ad-hoc dashboard and a custom dashboard?
An ad-hoc dashboard is a one-click dashboard created for a specific survey. You can use it as a quick starting point, customize it, and save it as a custom dashboard.
A custom dashboard gives you full control over the charts and survey data you want to include. Custom dashboards can be built from scratch and can include data from one or multiple surveys.
Can one dashboard include data from multiple surveys?
Yes. You can include survey response data from multiple surveys in a single dashboard or chart, as long as the data is stored in the same Refiner environment.