Troubleshoot JavaScript SDK
Debug Mode
Our JavaScript SDK has a built-in Debug Mode which will help you to track down and troubleshoot issues with your Refiner installation. When activated, an information panel in the top left corner of your web-browser will provide insights about the current state of your installation.
Activate Debug Mode
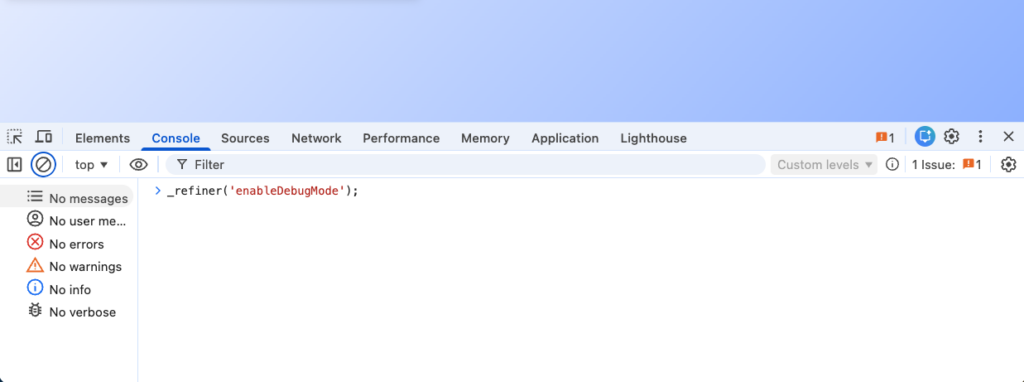
The simplest way to enable the debug mode of our JavaScript SDK is to execute the following method:
_refiner('enableDebugMode');
You can execute this method either in your app code, or in the developer console of your browser.
Once enabled, the Debug Mode stays active in your current Browser until you disabled it. Keeping the Debug Mode persistent is helpful when debugging for examples page load triggers.
To disable Debug Mode, execute the same method with ‘false’ as the second parameter:
_refiner('disableDebugMode');
If you can’t access the source code of your app or the developer console of your browser, you can also enable the debug mode through URL parameters.
You can either add #refiner_debug=true or ?refiner_debug=true to the URL of your web application and reload the page.
https://your-app.com#refiner_debug=true
https://your-app.com?refiner_debug=true
You can use the same technique to disable the debug mode by adding refiner_debug=false to the URL.
https://your-app.com#refiner_debug=false
https://your-app.com?refiner_debug=false
Debug Panel
When the Debug Mode is enabled, an information panel appears in the top left corner of your browser window as shown below.
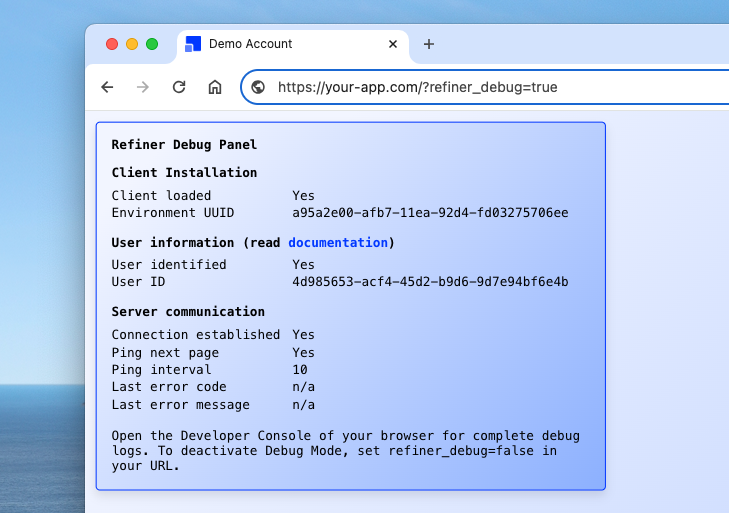
The information panel provides information on whether or not our client was installed correctly, if you are identifying your users, and if there are any communication issues with our servers.
If the information panel does not appear, please try reloading the page again. If it still doesn’t appear, please refer to Debug Tip #1 further below.
Debug Logs
In addition to showing the Quick Debug Window, enabling Debug Mode will also generate detailed logs. To inspect those logs, you need to open the Developer Tools Console of your browser.
In Google Chrome you can open the Developer Tools with the keyboard shortcut “Option + ⌘ + J” on macOS, or “Shift + CTRL + J” on Windows/Linux.
In Firefox, the Developer Console can be opened with the shortcut “Ctrl + Shift + I” or F12 on Windows and Linux, or “Cmd + Opt + I” on macOS.
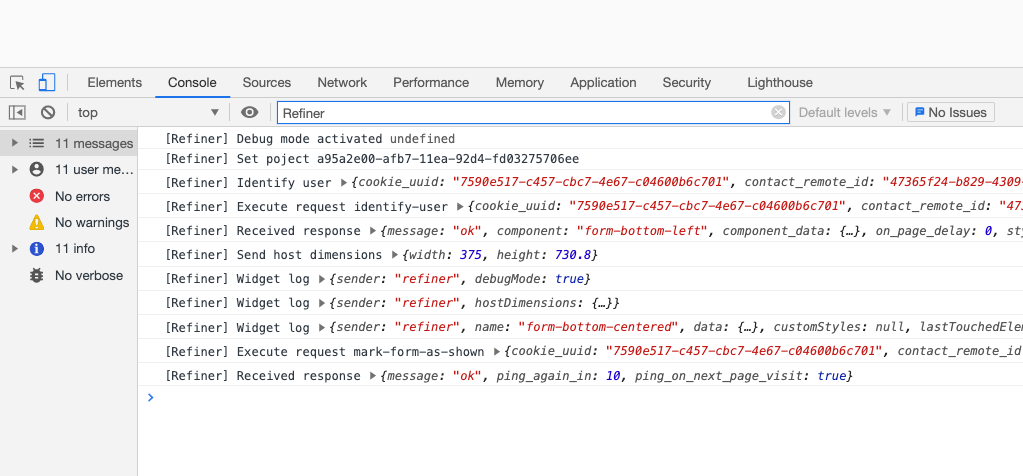
Once opened, navigate to the “Console” tab. You should see detailed logs about all important events and data exchanges with our server.
When interacting with our support team, a screenshot of the logs as shown below will be incredible helpful.
Troubleshooting Tips
Debug Tip #1: Check if SDK is loaded
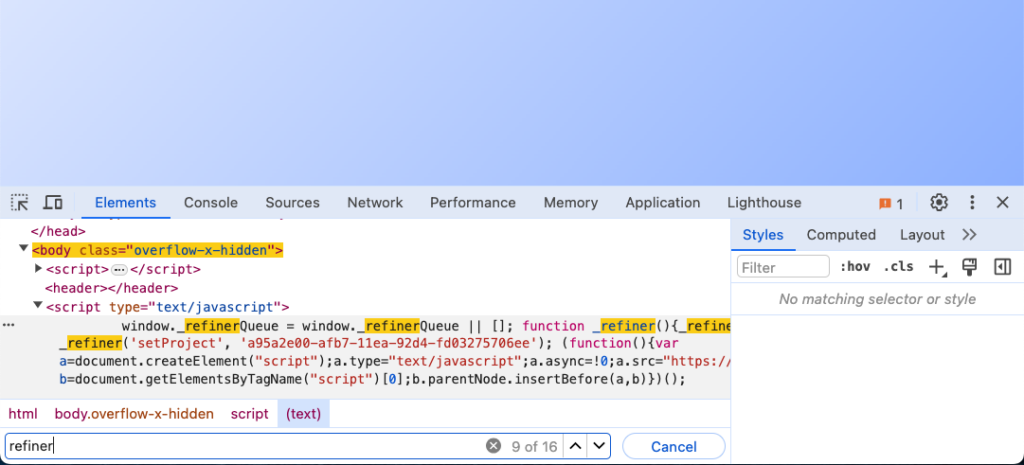
If the Debug Mode information panel doesn’t appear, our client was most likely not loaded into your HTML. You can open the Developer Console of your web browser and search for “refiner” in the HTML code. If searching for “refiner” does not return any results, the client was not added to your HTML page.
Debug Tip #2: Test with a newly opened Incognito Window
Our JavaScript client leverages the local storage of your browser to reduce the amount of data that is getting exchanged between the browser and our servers.
For example, our client will detect that a specific “identifyUser” call was already sent to our servers. This is done by storing a hash value in the local storage of your browser.
To avoid any issues related to this mechanism, we recommend to always test Refiner in a newly opened incognito browser window.
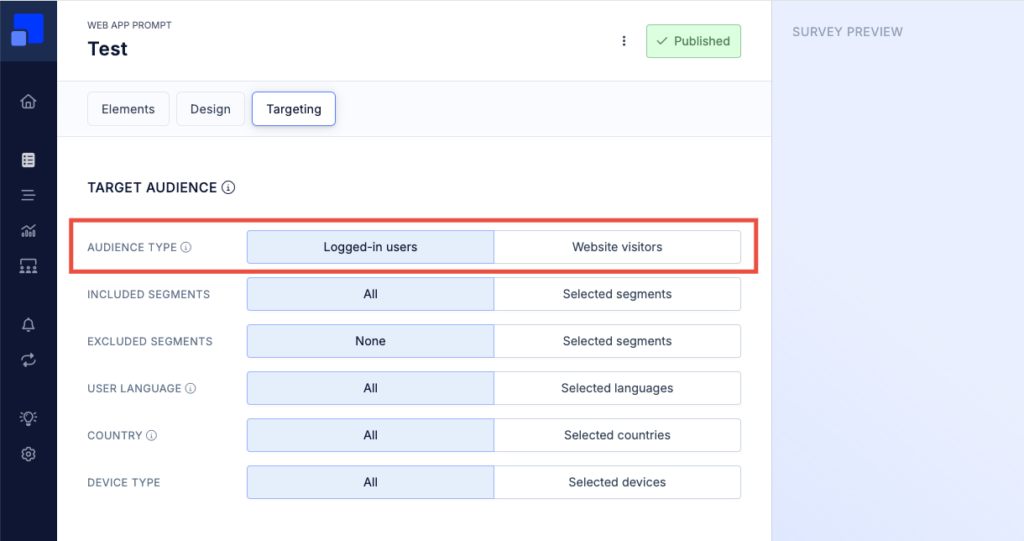
Debug Tip #3: Check if your are using the audience type
The JavaScript SDK can be operated in Identified Users or Anonymous mode. Our debug window indicates which of the following modes your are using.
Depending on the mode you are operating in, different Audience Type settings apply.
When you can identify your users, the “Logged-in users” option is the right choice for you.
When you can’t identify your users, for example when launching surveys on a marketing website, you’ll choose “Website visitors” as the target audience.
Debug Tip #4: Reset user data in your account to start over
You’ll like run into the situation where you want to test a survey again which you’ve already completed or dismissed.
An easy way to resolve this kind of situation is to delete all data linked to your test user and start with a blank slate.
You have basically two options to do this:
- Locate your test user in the user list in your Refiner dashboard. You can easily find your test user by searching for their ID or email. Once located, select and delete it. Deleting the user profile will also delete all linked survey responses.
- You can also chose to purge all user data in your Refiner project. Navigate to SETTINGS > ATTRIBUTES and click on “Purge User Data”. This will remove all contact data, including survey responses.
In both cases, don’t forget to open a new incognito window in your browser for further testing. A new incognito window will make sure that no old user data is still stored somewhere in your browser.
Debug Tip #5: Inspect network tab
Using the developer console of your browser you can inspect all network communication between your browser and our backend servers.
Setting the request filter to “Fetch/XHR” and searching for “refiner” shows all relevant requests. All requests should end in a Status Code 200 or 201 as shown above.
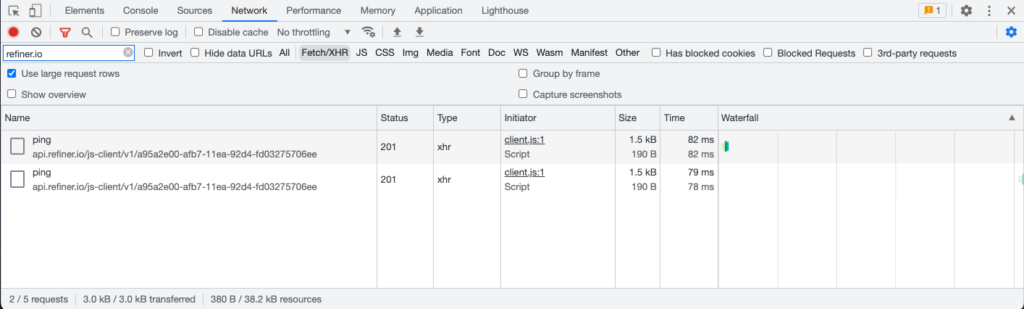
If any of the requests return a 4xx or 5xx error, click on them to reveal the response of our server. Ideally, the response includes a helpful error message. If that’s not the case, make a screenshot and send it to our support team for further assistance.