
Open Text Question
Introduction
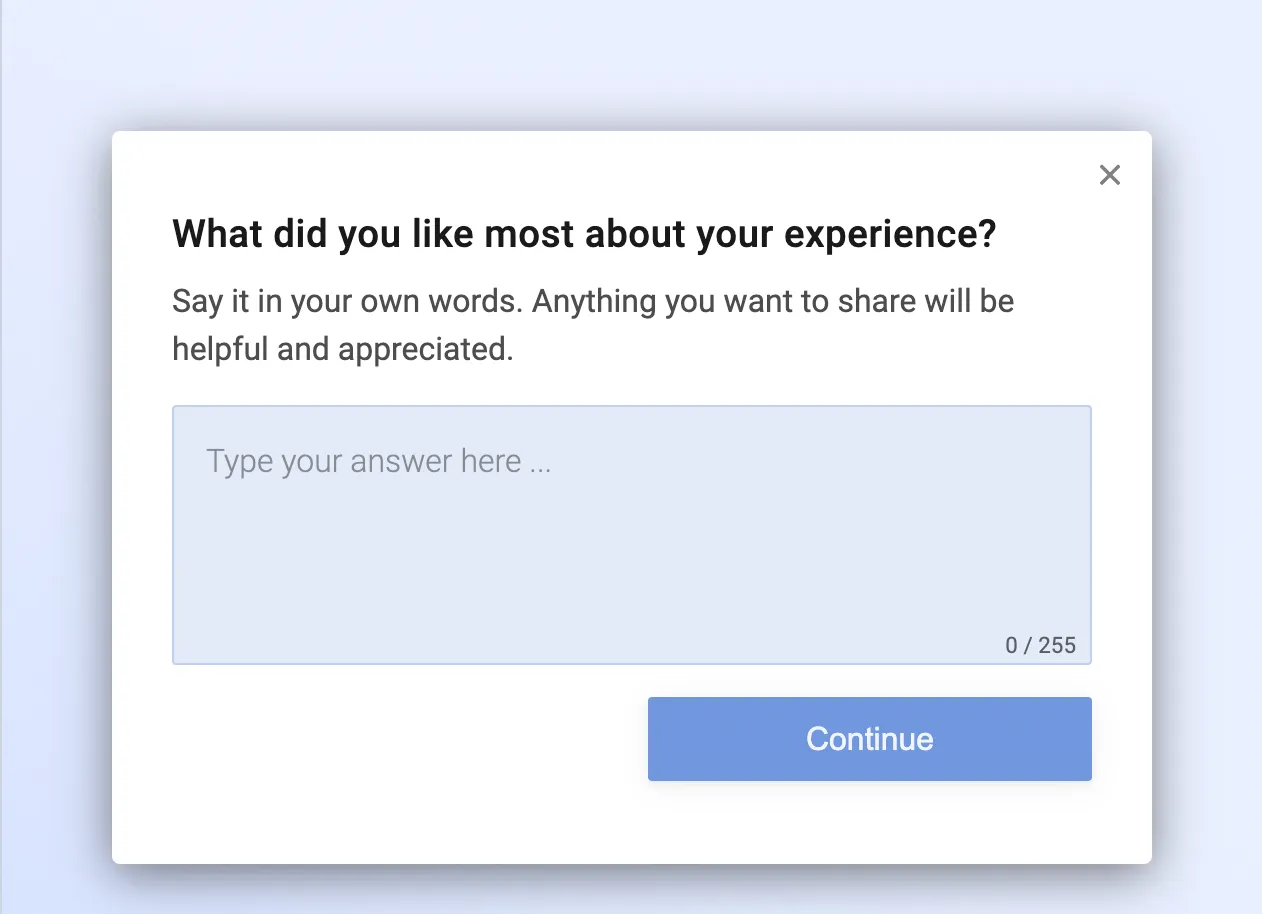
Section titled “Introduction”Open Text questions let users answer in their own words. Use one when you need the reason behind a score, a feature request, or any comment that does not fit a fixed list of choices.
Pick a different element when the answer should be structured:
- Use a Multiple Choice question when you want to count answers in charts.
- Use a Form Panel when you need several fields in one step, such as a name and an email address.
Add an Open Text question
Section titled “Add an Open Text question”In the Survey Editor, add an Open Text question and write the question title. Add a description when users need more context than the title alone.
A common setup is a follow-up after a rating. For example, show “What could we improve?” only after a low score. Configure that on the Open Text question with Survey Logic, using Only show if ….
Set the answer length
Section titled “Set the answer length”Open the question and select the Options tab.
- Max. Characters caps the answer. Refiner stores at most 10,000 characters. Set a lower limit when you want a short comment.
- Min. Characters sets the shortest answer you will accept. This field is available only when the question is Mandatory. Use it when a one-word reply would not help, for example a minimum of 20 characters on a follow-up about what went wrong.
Other options
Section titled “Other options”- Mandatory: Require an answer before the user can continue. Leave this off when the comment is optional, which is the usual choice after a rating.
- Placeholder text: Hint text in the empty field, such as “Type your answer here…”.
- Data identifier: Name used when the answer is stored. Refiner creates one from the question title. Read Data Identifiers before you change it.
Read the answers
Section titled “Read the answers”Open Text answers are individual comments. They do not appear in Bar, Pie, or Distribution Trend charts.
Read them on the Response Lists page, or add a Responses List chart to a dashboard. The same list can be downloaded as a spreadsheet. Include Response Data so the written answers are in the file.
To group comments by topic, add Tags. You can tag responses yourself, or let Refiner AI apply a tag from a description you write. Tag Overview and Tags Trend charts then show which topics come up most often.