
Rating Scale
Introduction
Section titled “Introduction”A Rating Scale asks for one score on a fixed numeric scale. Use it when you want a satisfaction check, a Customer Effort Score, or any other opinion stored as a number from 1 upward.
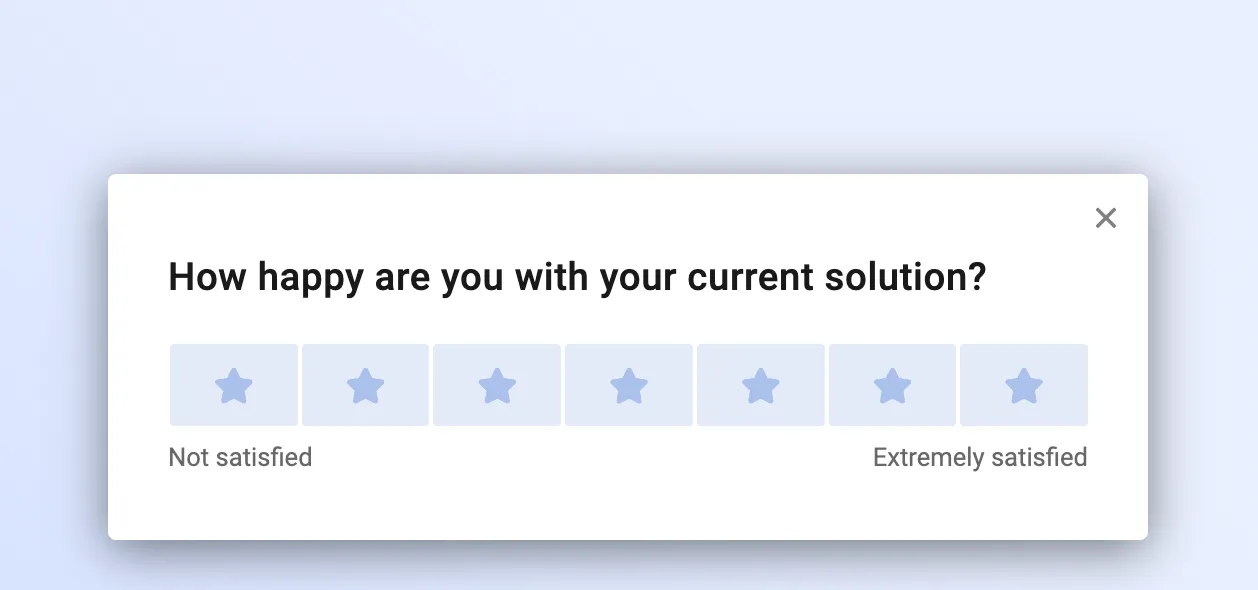
Choose a different question when the score follows a standard method, or when you need more than one rating on the same screen:
- Use NPS for the 0–10 recommendation question. NPS groups answers into Promoters, Passives, and Detractors.
- Use CSAT when you want a satisfaction score based on positive answers.
- Use a Rating Matrix when users should rate several statements in one step.
Other pages call this question a Star & Number Rating. The settings on this page are that question.
Choose the scale
Section titled “Choose the scale”Open the question in the Survey Editor. Scale is 4, 5, 7, or 10 points. Refiner stores the answer as a whole number from 1 through that many points. A five-point scale stores 1, 2, 3, 4, or 5.
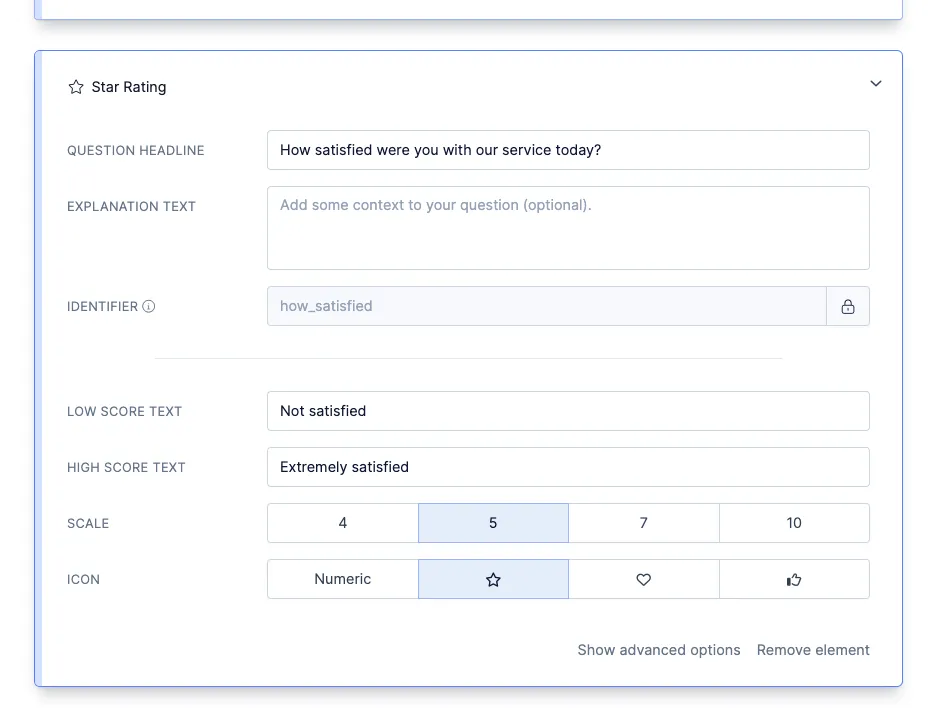
Pick the scale before you collect answers you want to compare later:
- 5 points is a practical default for a general satisfaction question.
- 4 points has no middle value, so each answer leans low or high.
- 7 points fits a Customer Effort Score survey. The CES template is a ready-made starting point.
- 10 points splits answers more finely. A 10-point Rating Scale runs from 1 to 10 and is reported as an average. An NPS question runs from 0 to 10 and uses its own score.
Low score text and High score text label the two ends, such as “Not satisfied” and “Extremely satisfied”, or “Very difficult” and “Very easy”. Readers see the labels. The stored answer is the number.
Write the question in Question headline. Use Explanation text when the headline needs a sentence of context.
Choose numbers or icons
Section titled “Choose numbers or icons”Icon sets what appears on each point:
- Numeric shows 1 through N.
- Star, Heart, and Thumb-up show that icon on every point.
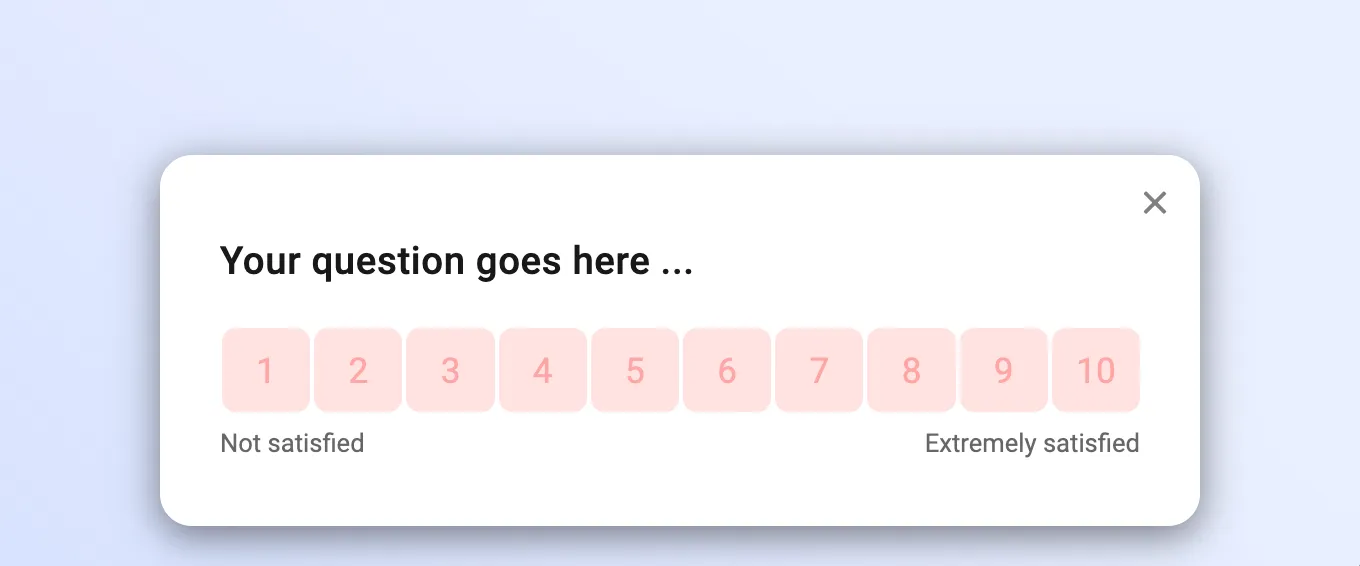
Stars, hearts, and thumbs are stored as the same numbers as the numeric scale. The third star is a 3.
Other options
Section titled “Other options”- Mandatory: The question requires an answer. Open Show advanced options to make it optional.
- Banner image: The same advanced options include an image for this question. You can also set one banner for the whole survey in Branding.
- Identifier: The name used when the answer is stored. Refiner creates it from the headline and locks it after you save the survey. Read Data Identifiers before you change it.
Read the scores
Section titled “Read the scores”A Ratings chart shows the average and how many people chose each number. An ad-hoc dashboard includes a chart for each question in the survey. You can also add a Ratings chart to a custom dashboard.
Put only questions with the same scale on one Ratings chart. A 1-to-5 question and a 1-to-10 question use different ranges, so their averages belong on separate charts.
To learn why someone chose a score, add an Open Text follow-up and show it with Survey Logic. For example, use Only show if … so “What made this difficult?” appears only after a low score.