In-app Survey Response Rates (2025 Report – NEW DATA)
TL;DR (2025 in-app survey response rate at a glance)
- Typical in-app survey response rate (2025): 27.52%
- Typical in-app survey completion rate (2025): 24.84%
- Typical web app in-app survey response rate: 26.48%
- Typical mobile app in-app survey response rate: 36.14%
- Survey distribution: The majority of survey response rates fall within the 10% – 155 bucket.
- Response rates by survey type:
- NPS: 21.71%
- CSAT: 26.29%
- Mobile: 36.14%
- Web: 26.48%
- Best performing survey length: Surveys with 4-5 questions yield the strongest response rate.
In-app surveys have grown in popularity since we conducted our first response rate survey in 2022.
In fact, I’d wager that today, more SaaS or digital products companies turn to in-app surveys than to email or web-based ones.
However, in spite of such a wide adoption rate, the question about potential response rate remains top of the founders’ minds.
(I know because they regularly ask me about it, hoping to verify whether their results at least come close to their industry averages.)
So, in 2022, we conducted our first in-app survey response rate study. (You can view our original report findings at the bottom of this page.)
In 2025, we decided to test whether in-app surveys continue to perform as well as they did back then.
And so, what you have in front of you are the findings to Refiner’s In-app Survey Response Rate Report 2025.
Report terminology
Before we dive into the data, let me briefly explain terms you’ll see prominently throughout this page:
- Survey view – a survey displayed for a user in the app.
- Response rate – the number of survey views where the user answered at least one question in the survey.
- Completion rate – the total number of survey views where participants responded to all questions in the survey.
In-app Survey Response Rates 2025
Just like with the 2022 research, to make our research statically significant, we decided on certain ground rules for evaluating in-app survey performance.
For this research, we evaluated the performance of 1382 in-app surveys created with Refiner that passed the following criteria:
- The widget had to have generated at least 100 survey views during the original survey run,
- The survey also had to collect at least 50 responses during its run.
In total, the 1382 surveys we evaluated generated 50,305,103 views and 6,137,194 survey responses.
Here’s what we found.
Response and Completion Rates
Let’s start with the big one – How do in-app surveys perform in 2025?
Well, based on our data, exceptionally well.
Take a look.
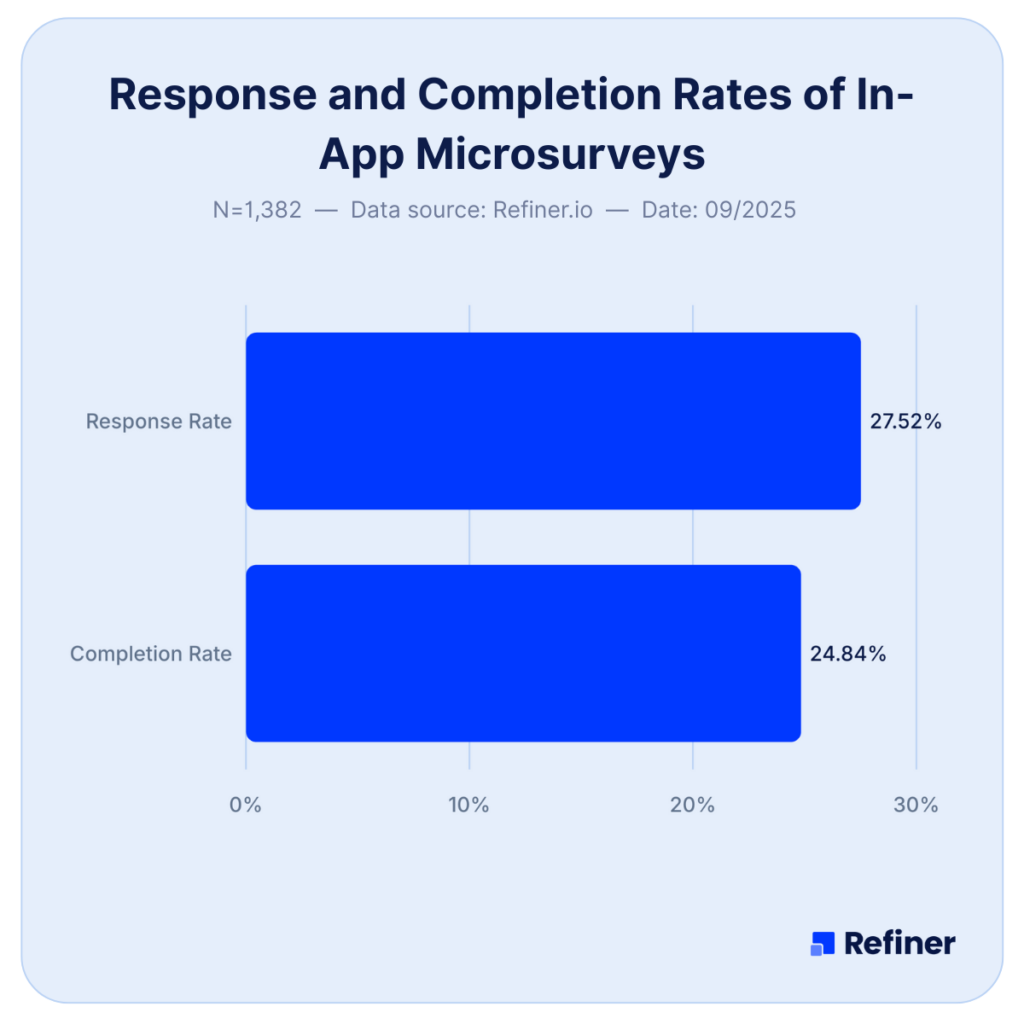
The 1382 in-app surveys we analyzed delivered:
- An average response rate of 27.52%, and
- An average completion rate of 24.84%
In comparison, in 2022, surveys we analyzed delivered 25.25% of response rates. Completion rates fared just slightly below that, at 23.04%.
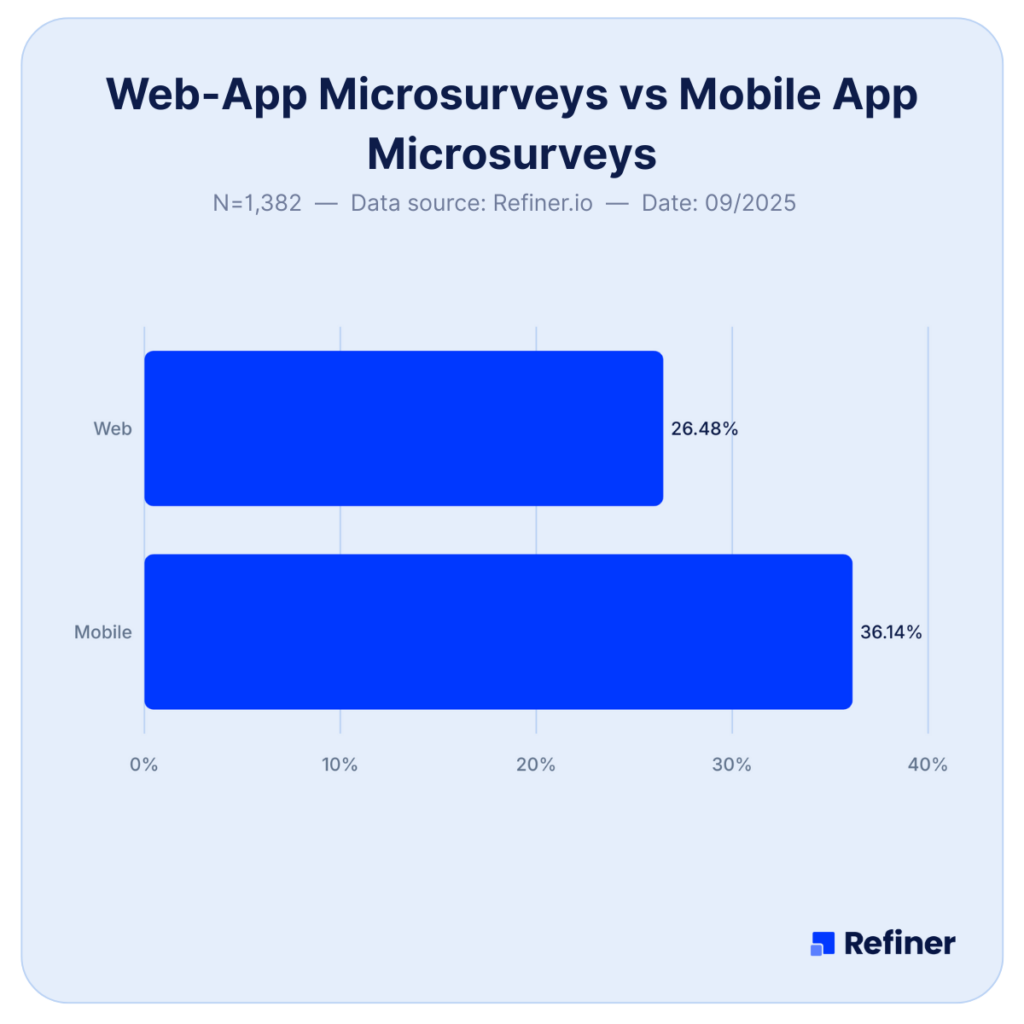
Mobile vs Web App In-app Surveys
When we talk about in-app surveys, we usually mean one of two specific types of applications where these surveys could be triggered:
- Web apps (software that works in your browser, like Refiner, for example.)
- Mobile apps (applications that are created specifically to be used in smartphones and other mobile devices. Your bank app is a good example here.)
Naturally, surveys in each of those applications perform differently.
- In-app surveys in web apps deliver a 26.48% response rate
- In-app surveys triggered in mobile apps, however, deliver a staggering 36.14% response rate.
BTW, I do appreciate that this finding might seem insignificant at first. The two platforms are independent from each other, after all.
However, these findings are important for a company that operates both a web app and a mobile app.
Based on these findings, it’s clear that it would get a far better response rate and gather better (and more!) customer feedback if it launches the survey within the latter, right?
Survey Length
This is another common question regarding in-app surveys:
“How long should my in-app survey be, ideally?”
And it makes sense, right?
On the one hand, you want to collect all the insights you seek. But at the same time, you don’t want to sabotage the survey’s success by making it too long or too difficult for users to complete.
So, here’s what our research says about ideal survey length….
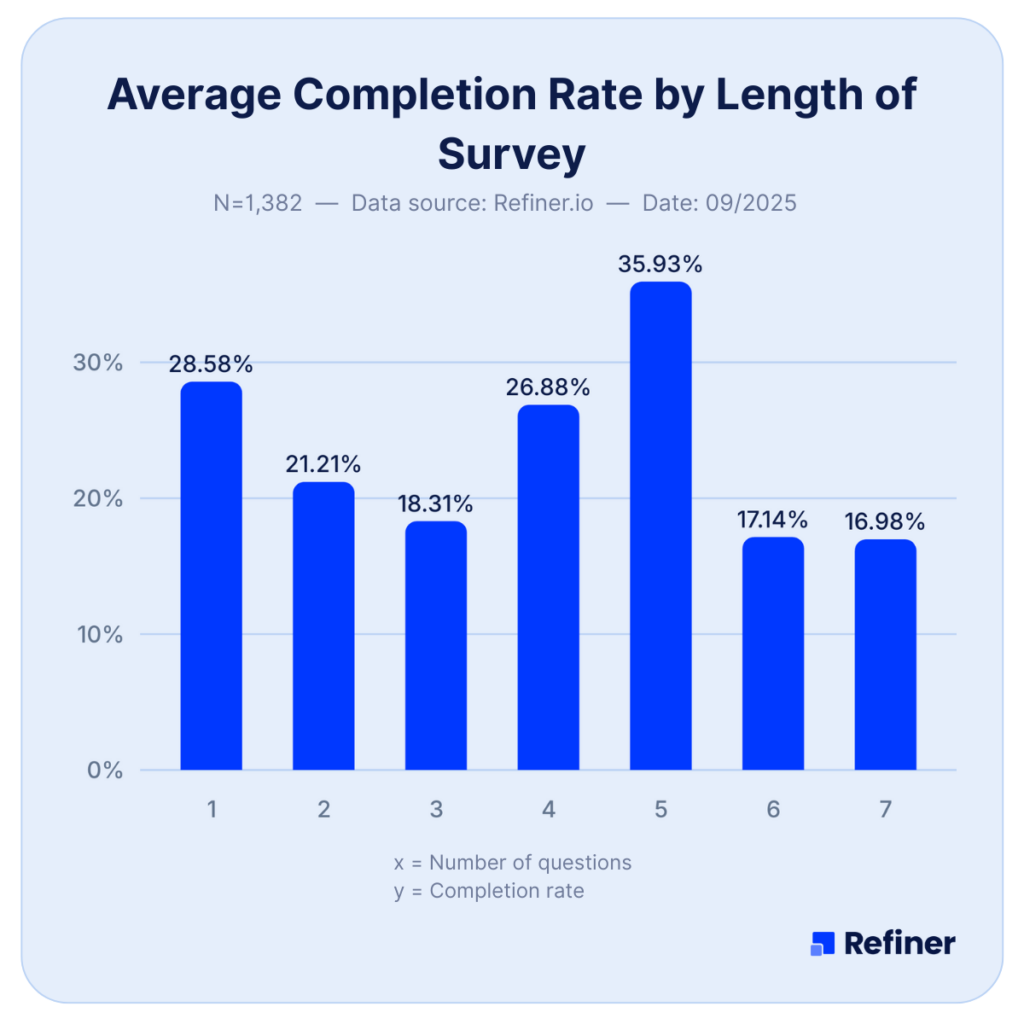
Intriguing, right?
To get the highest possible response rate, your best bet seems to be either to
- trigger a single question survey (like NPS or CSAT) or
- have it contain 4 or 5 questions. And, as a matter of fact, the latter could trigger a far better number of responses than the former.
Now, that’s something you don’t hear very often, do you?
Most advice around the web tries to convince you that the shorter is better. And yet, based on our data, the sweet spot for your in-app survey is actually:
- Just one question or
- 4 – 5 questions.
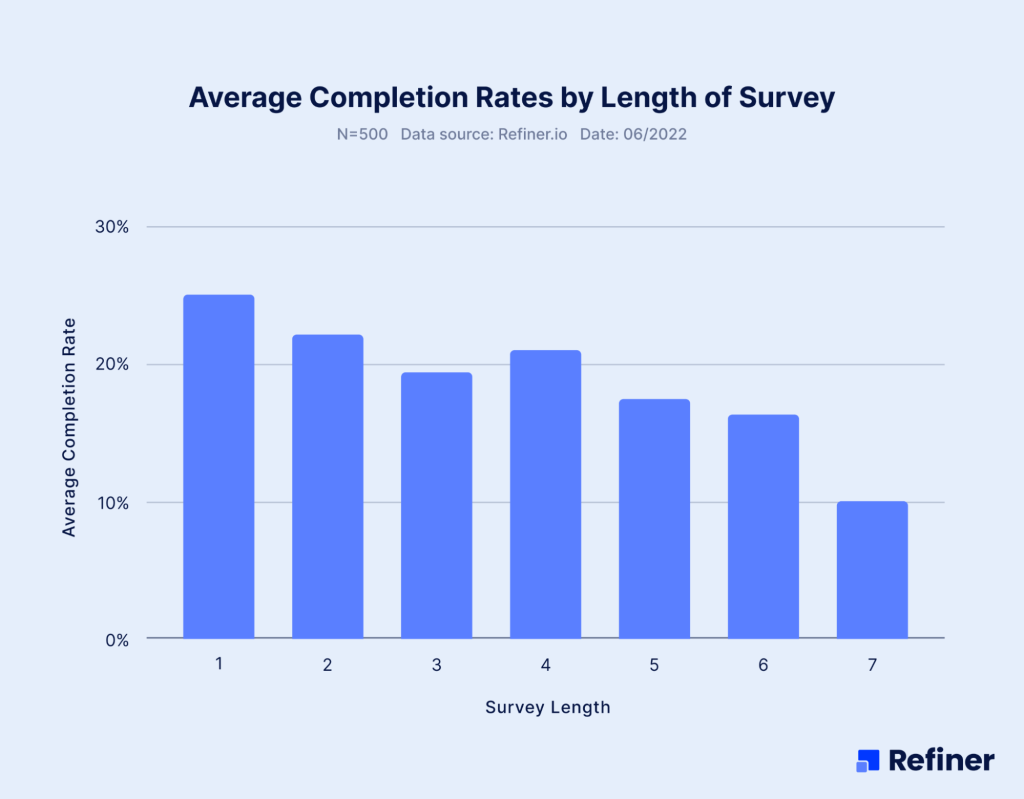
How does this compare with our previous findings?
Well, this is another intriguing aspect of this finding.
You see, in 2022, we discovered that single-question surveys performed significantly better. In fact, one question in-app surveys greatly outperformed longer surveys.
Take a look…
Today, however, longer, 4-5 questions surveys seem to deliver a better response rate.
One possible explanation for this is the increased adoption of mobile-first surveys.
It’s more natural for us to tap several answers on a smartphone than do the same on a computer. After all, we consider these two devices differently, and tend to perform different tasks on them.
Smartphones are in our hands all day. We often spend time tapping, scrolling, and so on. In fact, these actions are the staple of using a smartphone, whether you’re consuming information or browsing and purchasing products. So, an in-app survey that requires several taps to answer all questions doesn’t actually disturb our flow. It fits nicely into it, in fact.
However, that’s not the case when it’s triggered on a computer screen… Many computer-first tasks involve typing, reading, analyzing, and interacting with various programs to complete actions that often require concentration and focus. An in-app survey popping on screen is more likely to disturb that flow.
Survey Placement
Just like length, survey placement – the exact location where you display it in your web or mobile app – has an enormous impact on the response rate.
But to present the data properly, we need to look at each application type – web-app and mobile – separately.
Web-app Survey Placement
In 2025, by far, the survey placement that delivered the highest response rate was simply a modal at the center of the screen.
The center of the screen modal delivered 42.6% response rate (based on 254 surveys in our study that used this placement.)
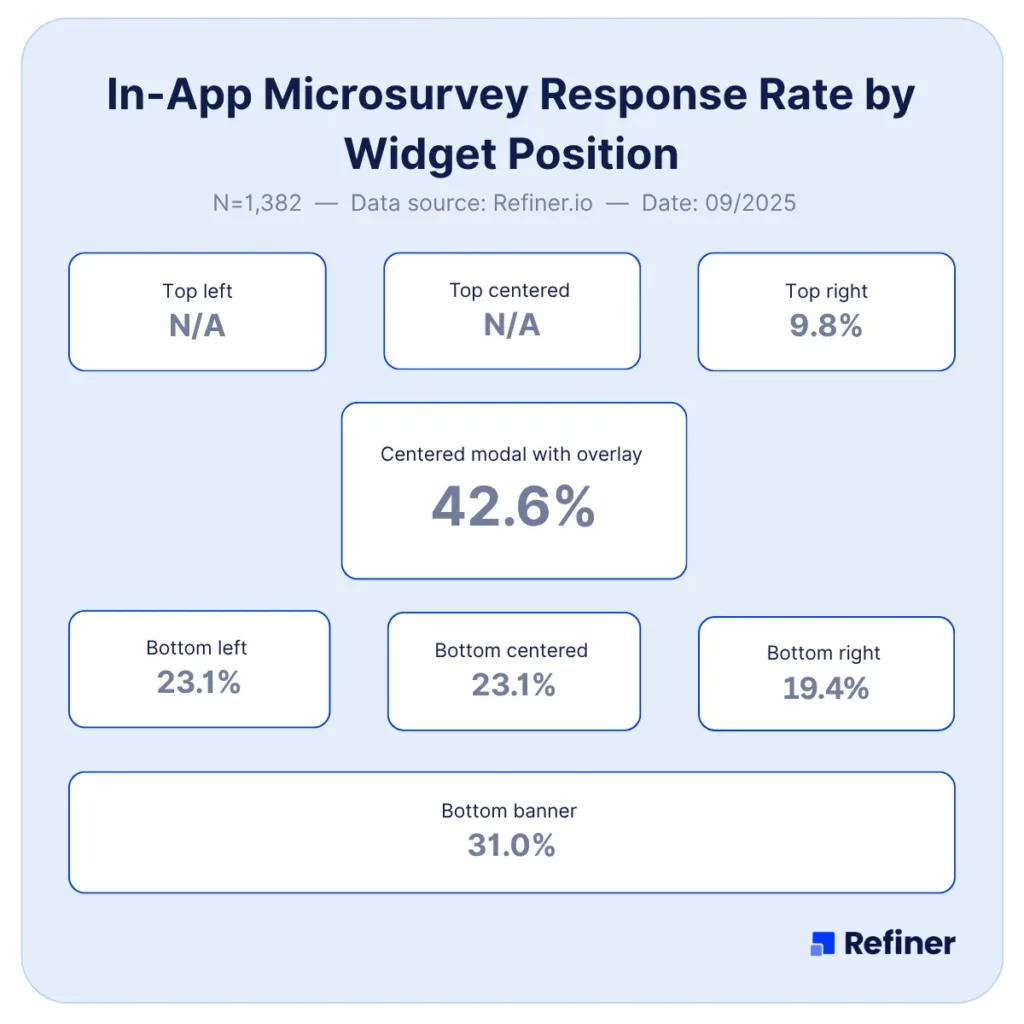
An interesting data point, and perhaps a signal of an emerging trend, is the performance of top-centered surveys.
These surveys delivered even higher response rates, at 47.8%. However, since only 17 surveys in our study used that placement, it is quite hard to compare it with the modal.
That said, it might be a one worth testing out.
Mobile App Survey Placement
I have to say that evaluating the best placement of in-app surveys on mobile apps turned out a little bit more problematic.
The reason for that is that companies seem to use primarily one placement, without testing any other.
And so, in our study, we found that a survey placed at the bottom of the screen performed significantly better than other placements. It delivered a 34.8% response rate.
However, it is worth noting that this result is based on a disproportionately large number of surveys using this placement. 86% of mobile app surveys we evaluated used that placement.
This finding makes it a little bit more challenging to advise on the best placement.
On the one hand, it’s clear that an in-app survey placed at the bottom of the screen is guaranteed to perform well.
However, surveys using a full screen modal performed even better. Unfortunately, since only 9 surveys in our study used that placement, it is almost impossible to draw any conclusions from their performance.
In-app NPS and CSAT Survey Response Rates 2025
Aside from looking at overall in-app survey performance, we decided to also dig a little bit deeper, and evaluate how the two most popular in-app survey types perform – NPS and CSAT.
In-app NPS
We analyzed 283 in-app NPS surveys that generated 5,091,330 views and 747,099 responses.
Survey performance results:
- In-app NPS response rate: 21.71%
- In-app NPS survey completion rate: 18.74%
In-app CSAT
We also analyzed 259 in-app CSAT surveys; 4,575,391 views; and 636,278 responses and found:
- In-app CSAT response rate: 26.29%
- In-app CSAT completion rate: 22.73%
In-app Survey Benchmarks
Let’s tackle the third most common question regarding in-app surveys – How does my survey perform vs the others.
So, below, I’ve compiled benchmarks to compare your surveys against.
And needless to say, if your performance is already within those three brackets, you’re doing good.
And hey, if it’s not in the Excellent range, you know you can improve it.
| Good | Great | Excellent | |
| Overall | > 15 % | > 25 % | > 44 % |
| NPS | > 14 % | > 18 % | > 32 % |
| CSAT | > 17 % | > 25 % | > 41 % |
| Mobile App | > 19 % | > 35 % | > 62 % |
| Web App | > 15 % | > 24 % | > 42 % |
In-app Survey Study Comparison 2022 vs 2025
| 2022 | 2025 | |
| Response rate | 25.25% | 27.52% |
| Completion rate | 23.04% | 24.84% |
| Best placement | Centered modal | Centered modal |
| Best length | Single-question | 4-5 questions |
Definitions and Glossary
In-app survey: A question or two shown inside your product, while the user is doing something. Read more: https://refiner.io/blog/in-app-surveys/
Response rate: Unique people who answered, divided by unique people who saw the prompt, in your chosen window. Read more: https://refiner.io/blog/in-app-survey-response-rates/ and https://refiner.io/blog/improve-in-app-survey-response-rates/
Completion rate: People who started and finished the survey, divided by people who started.
Viewer: A unique user who saw the survey at least once.
Trigger: The rule that shows the survey. Event-based after an action, or time-based.
Timing: When the survey pops up on screen. Read more: https://refiner.io/blog/in-app-survey-timing/
Targeting: Who you show it to.
Frequency cap: How often a single user can see a prompt.
Placement: Where the prompt appears on screen. Inline, modal, or full-screen.
Survey length: How long it takes to finish. Dismissal: User closing the survey without starting.
And there you have it…
… a research-based answer to whether in-app survey work, and what sort of results you could expect from them.
What’s left now is to go on and start collecting product feedback with in-app surveys.
Good luck!
In-app Survey Response Rates – FAQ
Across our dataset, the average response rate is 27.52%. Use that as your baseline when you benchmark your own surveys.
The average completion rate is 24.84%. If you are close to that, you are in a healthy range.
Yes. Mobile app surveys average 36.14% response rate, while web app surveys average 26.48%. If you have both platforms, prioritize mobile to collect more feedback.
In our sample, CSAT performs higher than NPS. CSAT response rate is 26.29% and NPS is 21.71%. Completion rates follow the same pattern.
Two sweet spots stand out. Single‑question surveys perform well, and 4 to 5 question surveys perform best overall in our 2025 data. Test both formats for your use case.
A center‑screen modal delivered 42.6% response rate across 254 surveys. Top‑center performed even higher at 47.8%, but the sample size was small, so treat it as a test idea, not a rule.
Bottom‑of‑screen prompts are widely used and perform well at 34.8% on average. Full‑screen modals performed even better in our data, but the sample was tiny, so validate in your own product.
Response rate is views where a user answered at least one question, divided by total views. Completion rate is surveys finished divided by surveys started.
Averages improved. Response rate rose from 25.25% to 27.52%, and completion rate from 23.04% to 24.84%. The optimal length shifted from single‑question to 4 to 5 questions as a new sweet spot.
Start with placement and length, then fine‑tune timing and targeting. Frequency capping and clear copy can reduce dismissals.
Compare your numbers to the averages above, and segment by survey type and platform. If you are behind, test placement first, then adjust length, timing, and targeting.