12 SaaS Customer Engagement Metrics You Should Track
Are you planning to start measuring customer engagement? Wondering what customer engagement metrics your SaaS should track?
It really goes without saying, doesn’t it? The more value users get from your product, the more likely they are to keep using it (and paying you the bucks, of course.)
The problem – Sometimes, it’s quite hard to figure out how engaged customers are with your SaaS. Do they even like it? Could they live without it? Are they getting any meaningful value from it?
In this guide, I’ll show you exactly how to figure that out, and what customer engagement metrics to use in the process.
Before we get to that, though, we have to cover some basics.
What is Customer Engagement?
The term – customer engagement – refers to an intricate relationship between a product and its users. In the simplest terms, we can define it as an indication of how engaged customers are with our products.
Those who are, draw value from using a product. Unengaged users, on the other hand, will most likely abandon the product sooner or later (if they haven’t done so already.)
But here’s the catch – the concept of engagement might seem simple. Unfortunately, measuring it is actually quite challenging, especially in SaaS.
The Challenge with Measuring Customer Engagement
You see, engagement works differently across products or services.
Take frequency of usage for example. Seeing people logging in to the app every day would certainly confirm the engagement, right?
Well, yes, but only for some products.
Some apps need to be used almost every day. Think of small business accounting or email platforms. You often remain logged into a live chat app, or a productivity, or time-tracking product for almost the entire day too.
That’s how you get the value from those tools.
But other products, like email automation platforms or my tool, Refiner, don’t require regular use to deliver value. With Refiner, you could set up a survey, and let it run for a while. You can log back in to review the feedback, of course. But often, the data comes directly to your inbox or another tool, through a particular integration. As a result, you don’t need to return to the tool that often, unless you want to run another survey or edit the current project.
However, that doesn’t mean that you don’t receive value from it.
Quite the contrary. The value of the product lies in the data it delivers, after all.

This brings us to challenges with defining customer engagement metrics…
Because engagement means different things to different products, there isn’t any universal metric that you could use to measure it.
You can do that when measuring other aspects of your SaaS success. There’s NPS for customer loyalty. CSAT helps you evaluate the customer experience. A churn rate helps you spot potential problems with onboarding. Traffic growth tells you how well your SEO or other marketing strategies work, and so on.
Unfortunately, there is no single, universal user engagement metric.
But it doesn’t mean that you can’t track it, though. It’s just that, to do so, you first need to define what engagement means for your SaaS.
You have to figure out what actions or activities would confirm that a person is getting value from your product, and base your engagement metrics on that.
For some apps, it might be a usage level. A person signing in to their live chat dashboard clearly gets value from the product.
For other tools, it might be a specific action, like using a particular feature. For a tool like Refiner, it might be running more than one survey at a time, or setting up integrations with their CRM or another tool.
Again, what these are will depend on your tool.
But what’s important is that knowing what engagement looks like for your SaaS will allow you to identify metrics that can help you measure it.
Having said that, I can give you some indication of what the most common engagement metrics are.
13 Customer Engagement Metrics SaaS Companies Use
Note, I’ve split this list into two categories.
The first one features general metrics that could help you determine engagement in general.
The other category includes the opposite – metrics that focus on evaluating engagement by usage, features, or behavior.
Let’s go through them in turn.
General User Engagement Metrics
#1. Net Promoter Score (NPS)
Net Promoter Score (NPS) is a metric used to track customer satisfaction and loyalty to a brand or a product. It’s also one of the most popular metrics in SaaS.
I’m sure you’ve stumbled across surveys like these in your favorite apps many times over.

Well, rightly so.
You see, NPS is an amazing tool if you want to find out how satisfied customers are with your product. Although it does not focus on engagement directly, the NPS score can tell you a lot about how valuable users find your product.
#2. CSAT
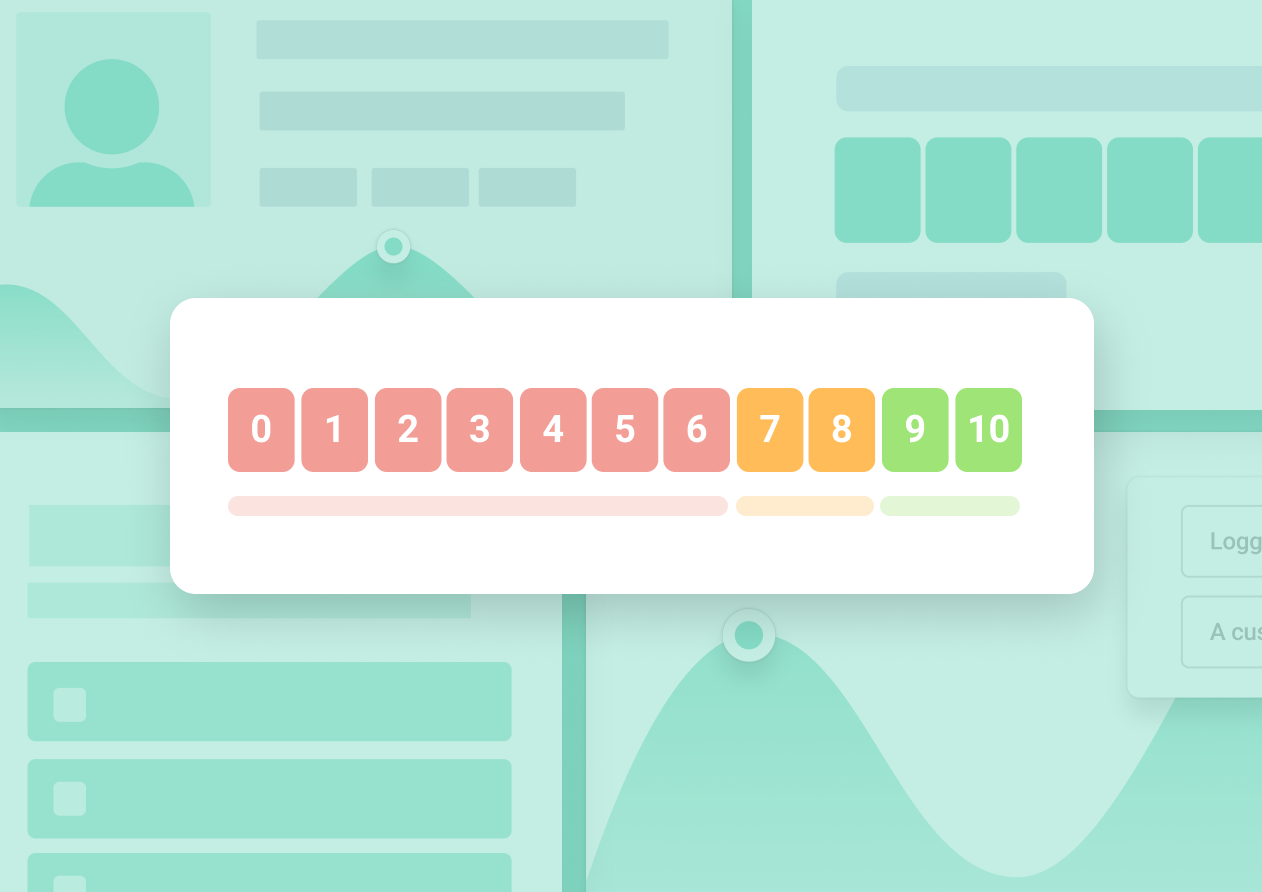
Customer Satisfaction Survey (CSAT) takes a different take on measuring customer satisfaction than NPS. Instead of inquiring about the likelihood of a person to recommend a product, CSAT asks about their satisfaction levels directly.
But just like with NPS, customers rate their satisfaction on a simple scale of 1-10, allowing you to evaluate the engagement levels across your entire customer base.
What’s more, both NPS and CSAT allow you to ask follow-up questions. With that, you can dig deeper into individual replies and discover the reasons why someone scored their satisfaction as they did.
Finally, because of its direct nature, you can use CSAT to evaluate engagement with your product, its particular features, or even specific areas of the business, like customer service.
This company, for example, uses CSAT to evaluate the satisfaction of one particular tool available on its platform.

#3. Customer Effort Score (CES)

CES surveys allow you to quickly identify friction points in your product experience. By asking directly about the ease of use of your tool or its particular features, you can discover areas that cause customers problems, and gradually improve your product.
Once again, this metric isn’t directly tied to engagement. However, measuring CES can help you identify how easy or challenging the product is. This information, in turn, can help suggest where potential engagement friction points are.
#4. Customer Lifetime Value
I realize that it might seem radical but think about it – Engaged users continue using the product and paying for it. Therefore, measuring the revenue a customer will bring during their engagement with your SaaS can reveal potential changes in engagement levels.
CLV that’s increasing over time might suggest that engagement levels are going up as well. Drops in CLV, on the other hand, might indicate that something is amiss.
Common Customer Engagement Metrics in SaaS
Below are common metrics SaaS companies use when tracking customer engagement.
Important – You don’t need to track all of those metrics. These are just examples of various engagement indicators that SaaS companies use.
Some of these metrics might work for you, of course. However, I strongly recommend that you first define engagement for your SaaS, and only then, try to identify metrics that would suggest it.
So, without any further ado, here are the most commonly used customer engagement metrics in SaaS:
#5. Usage levels or visit frequency
This metric focuses on how often customers sign in to use your product.
As I’ve explained above, the ideal visit frequency will depend on your product. Some products require daily or even hourly interactions to deliver value. For others, it might be enough to track weekly or even monthly usage.
Then, there are products that customers use only seasonally. A hiring platform is a good example here. Customers would use it heavily when they’re looking for new talent. But might not engage with the product much outside of those times.
So, to track this metric, you need to first determine the ideal usage level for your product, and then use it to monitor patterns in customer usage.
#6. Session time
Session time (or average session duration) focuses on the length of time that users remain active in the app per session.
Just like with visit frequency, the ideal time signifying engagement will differ between products.
So, once again, you need to decide what an ideal session length would be for your tool specifically and monitor how often users reach that length to establish engagement levels.
#7. Feature usage
Feature usage tracks your product’s most popular or most often used capabilities. The metric reveals which features customers favor and which ones deliver the greatest value to them.
#8. Pageviews
If you want to measure engagement with your website or marketing content, then the pageviews metric is one of the best metrics to use.
Pageviews measures the total number of website visitors to a particular page. It, typically, also includes users who have reloaded the page, returning visitors (within the same session), and so on.

#9. Bounce rate
Bounce rate tells you how many visitors leave your site almost immediately, without engaging with your content or information.
Unlike many metrics, however, a lower bounce rate is better. Here’s how it works:
- Low bounce rate means that visitors engage with your content. It reveals that the information catches their attention, and they continue consuming your content.
- A high bounce rate, on the other hand, suggests that they might not be understanding the value of your content. It might also suggest that your marketing efforts attract the wrong audience.

(Bounce rate data (total and per page) in Google Analytics)
#10. New user activity levels (aka first-week engagement)
This is an interesting and quite revealing metric to track. First of all, it helps you evaluate how new users engage with the product in the first week (or first several weeks, or the duration of the trial, you can choose the optimal time period for your SaaS.)
Secondly, it helps you go beyond just engagement. Monitoring new user activity levels can tell you quite a lot about your product:
- It can reveal whether potential customers find your product easy to use,
- The metric can shed light on how well your user onboarding process works, and
- It can also tell you whether customers understand the value of your product within that time frame.
But what’s important is that all this information can help you improve the product and the user experience, and boost its stickiness factor. And needless to say, all those factors will positively affect your engagement levels.
#11. Churn rate
I’m sure you’re well familiar with churn. It’s probably one of those metrics you already pay close attention to regularly.
Rightly so. Churn is scary, and certainly not something we want to see increasing.
But churn rate can also tell you a lot about engagement. For one, customers who stop using your product, and cancel their subscription, signify potential problems with engagement.
Of course, some of those people might have signed up by mistake or just out of sheer curiosity. Others had the wrong impression about what your product can do for them.
But in many cases, customers leave because they’re not getting enough value from the product.
That’s also where collecting customer feedback becomes so critical. It gives you a chance to understand why someone’s leaving your product and identify ways that could prevent others from doing the same.
#12. Core user actions
Core user actions are activities or tasks a customer performs when they’re engaging with a product.
These actions are specific to a product, of course.
For Refiner, it could be setting up more than one survey. Or running the same survey type regularly. Another common core action would be setting up integrations and sending data to other tools. It signifies that customers use the information to drive action in their business.
For an email marketing tool, it could be setting up lead capture forms, and collecting subscribers’ emails.
For a small business accounting package, it could be creating invoices. For a project management suite, creating and completing tasks, and so on.
Measuring core user actions reveals whether customers engage with the product in a way that a.) gets them to understand its value right away and b.) delivers that value over and over again.
Want to see how Refiner could help you collect customer feedback and deliver data to drive user engagement and experience? Try it for free now.