How to Calculate and Measure the Customer Effort Score in SaaS
Do you want to calculate your customer effort score but don’t know exactly how to do it? Wondering what are the different ways to measure the customer effort score?
Well, good news – In this guide, you’ll learn everything you need to know to do it. But we’ll discuss not just what customer effort score is or how to measure it. I’ll also show you what the score means for your SaaS and how to use it to increase customer loyalty and satisfaction, and boost your growth.
Intrigued? Let’s do it, then.
What is a Customer Effort Score?
Customer Effort Score (CES) is a survey that measures how easy it is for your customers to use or interact with your product.
In other words, CES measures the effort it takes for someone to use your product.
A CES survey, typically, looks like this:

In a typical CES survey, you can ask either a general question about the overall product experience or you can be more specific and ask about a particular feature, an interaction with your customer service or the level of effort it takes to access your resource library.
Be careful, a Customer Effort Score survey does not track customer satisfaction like a CSAT survey or customer loyalty like the net promoter score (NPS). Your CES questions should be framed in a way that the focus is on the effort and hopefully, the survey responses will indicate that your product guarantees a low-effort experience.
Why Do You Need to Measure Your CES?
Let’s look at the key reasons to start measuring your Customer Effort Score.
#1. Benchmark user experience and effort
A key reason to measure your CES is to understand how your customers rate the ease of using your product and how you can improve it.
You can’t monitor your progress in customer effort if you are not consistent with measuring it.
Benchmark your customer effort score the first time you’ll send a CES survey. No matter what the results are, this will be your starting point on the journey of improving the user experience and the effort it takes to use your product.
As part of the benchmarking process, you can also focus on different segments of your audience to understand where you stand among each type of customer.
For example, you may find that your new customers are not very happy with the effort it takes to use the product in the first week.
This could be an indication that you need to tweak the onboarding process to improve your CES score in this segment and boost your overall user experience.
#2. Understand your strengths and weaknesses in product experience
Your customer effort score and its frequent measurement can help you discover your product’s strengths and weaknesses.
Map out both the positive and negative outcomes you get out of the CES survey and use them to shape your product roadmap.
For example, a CES survey could help you discover that many users are finding a new feature you just launched quite complicated to use.
You can use the insights to act early on them rather than wait for your customers to churn in the future.
CES Calculator: How to Measure the Customer Effort Score?
Calculating the Customer Effort Score is simple. You can do it with this formula:
CES = Total sum of responses / Number of responses
Your Customer Effort Score is the total sum you receive in the responses divided by the number of responses.
Let’s say you launch a CES question on a numerical scale of 1 to 5:
How easy was it to use the X product?
The total sum from 150 responses was 600.
In this case, you can calculate your CES score this way:
600/150=4
Your CES score is 4 on a scale of 5.
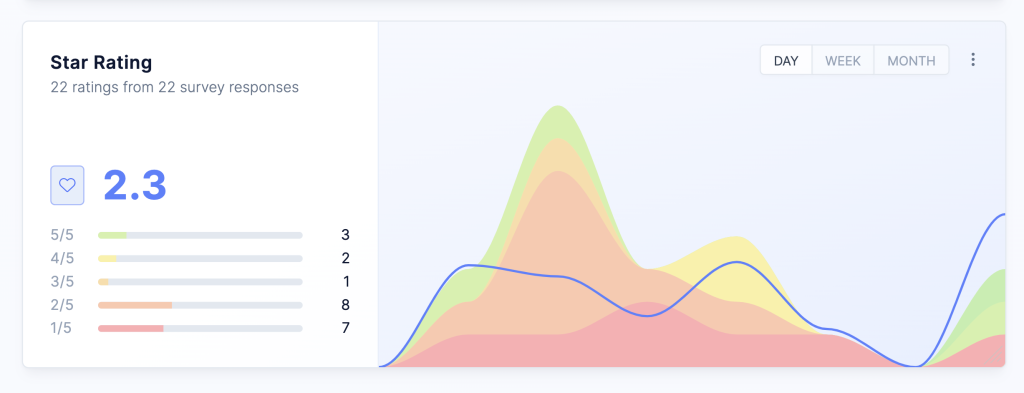
If you are using a tool like Refiner, you can track the evolution of your CES score on the reporting dashboard to monitor your progress.

Different Ways to Present and Measure CES
There are several different ways to present a CES survey – the format you choose will determine how you’ll measure your customer effort score.
#1. Numerical scale 1-5
It’s common to use a numerical scale in a CES survey to allow your customers to choose an answer based on the level of effort they need to use your product or service.
For example, you can ask the question:
How easy was it to solve your problem today?
The responses range from ‘Quite difficult’ to ‘Super easy’ on a scale from 1 to 5.
The design is clear and easy for your customers to pick the best answer for them.

#2. Numerical scale 1-7
Another way to present your CES survey is to use a numerical scale from 0 to 7. This survey type gives you more options, which expands the range of answers for your customers.
Let’s say you ask the question:
How easy was using this feature?

The answers range from ‘Quite difficult’ to ‘Super easy’.
You can also improve the design of your CES survey by adding emoticons to the range of options.

By adding thumbs up, hearts, or stars, you can grab your customers’ attention while making it even easier to measure their effort in a more visual way.
#3. Text-based scale
A different format for your CES survey is to follow the Likert scale and choose five to seven points that reflect the customers’ attitudes.
The Likert scale was introduced in 1932 and it’s widely used to quantify customer opinions allowing people to indicate how much they agree or disagree with a specific statement.
When it comes to customer effort, here are some ideas on how to use the Likert scale.
Ask about the product experience
Here is an example of a question you can ask:
It was easy to use Refiner

The numbers reflect the scale of answers from ‘Strongly Disagree’ to ‘Strongly Agree’ and they make it easier for your users to pick the best response that matches their user experience.
Ask about customer service
This is a question focusing on a customer interaction:
To what extent do you agree with the following statement: Refiner made it easy to handle my issue.

Ask about a particular feature
You can even measure the customer effort about a specific feature:
This feature was easy to use

By adding the numbers along with the text, it’s easier to calculate a median score, in the end, to measure your CES score using the formula we mentioned above.
What Counts As a Good Customer Effort Score?
The response depends on how you decide to present your CES survey.
Let’s say you send a CES survey on a scale from 0 to 5.
A good customer effort score, in this case, would be to go above 3, ideally close to 4.
If you are sending a CES survey on a scale from 0 to 7, a good customer effort score would be above 5.
No matter what score you get in your first attempt, it’s all about being consistent with it and hopefully increasing it over time.
Don’t worry if your score is lower than the average at first. You can add follow-up questions to your CES surveys to learn more about these responses and how you can improve the user experience.
How to Use Your CES Insights
You’ve started measuring your customer effort score and you are learning how to be consistent with its measurement.
How do you use the insights you are collecting? Here are three ideas.
#1. Improve customer success within your team
A customer effort score survey can help you be better with customer interactions by paying more attention to what your audience wants.
You can launch a CES question every time someone interacts with your customer service team. The question could be in the form of:
“How easy was it to solve your problem?”
The responses will help your team discover their areas of improvement while the feedback comes directly from your customers.
#2. Boost customer loyalty
How about combining your insights from different types of surveys?
You can combine the data you gather from a CES survey with your NPS score to strengthen your insights into what your customers want from you.
Imagine you’re discovering from your CES survey that many customers find your product easy to use. The next step is to look at your NPS score to confirm whether the ease of use translates to an increased chance of someone recommending your product to a friend.
Just like that, frequent check-ins with your customers can boost customer engagement by delivering more of what they expect. The more you pay attention to their needs, the easier it will be to have loyal customers in the longer term.
#3. Predict customer behavior
CES surveys can help you solve existing problems in your product but they can also help you predict potential issues you might face in the future.
Let’s say you are sending CES surveys to measure the effort it takes for someone to use your product’s key features.
Looking at the insights, you find out that most of your features got rated as ‘fairly easy’ to use. One feature though seems to require a higher effort of use.
This is the time to ask follow-up questions and act on the feedback.
Once you address this issue, the insights will help you avoid similar issues in the future with your next feature launches.
This way, you are saving time and resources while you are getting better at gathering behavioral insights.
How Is Your Customer Effort Score Linked to Your SaaS Metrics?
You don’t need to measure your data in silos. It’s time to make the most of your CES insights by linking them to your SaaS metrics.
CES surveys may be measuring customer effort but the data can still be useful for these metrics:
Customer engagement
Let’s say you launch a CES survey to measure how easy it is for your customers to interact with your brand.
The more you learn about them, the easier it is for your team to improve the overall customer engagement by keeping them interested in your product.
Customer upselling
You can use the insights from CES surveys to understand the level of effort it takes for your customers to use different product features.
For example, you can segment your users based on their CES score and combine the data with other survey types to map out the customers who might be ready for an upsell.
You don’t want to miss the chance to scale your SaaS business faster, do you?
Customer churn
The frequent measurement of your CES can help you understand what you need to improve in your product to avoid losing your customers.
For example, you can ask follow-up questions to the customers who find it quite hard to use your product or its particular features.
Use the learnings to address their concerns and prevent the churn.
Or if you are using a tool like Refiner, you can also sync your CES rating to your CRM to keep an eye on your clients to spot upselling opportunities and reduce churn.
Here You Are…
Everything you need to know on how to calculate your customer effort score.
Ready to send your next CES survey?
Make sure you organize the insights you collect to track the evolution of your customer effort score.
It’s okay if you are not where you want yet, just make sure you stay consistent with the measurement to monitor your progress.
Good luck!


