

Survey statistics: original data from Refiner's live surveys
Written by Moritz Dausinger, CEO of Refiner ·
These are the survey statistics from Refiner’s own research, in one place. Each one comes from real surveys run in Refiner between February 2019 and September 2026, and links to the study it comes from, with the sample size and method. Every statistic has its own link, so you can point to the exact number you’re quoting.
The numbers come from these studies:
- In-app survey response rates (2025): 1,382 in-app surveys, 50.3 million views, 6.1 million responses.
- Follow-up questions after NPS, CSAT, and CES (2026): 5,253 live surveys, about 15 million responses, 8,574 rating questions, 35 languages.
More details are in about the data.
Survey response rate statistics
Response rate is the share of survey views where the person answered at least one question. Completion rate is the share of survey views where the person answered every question.
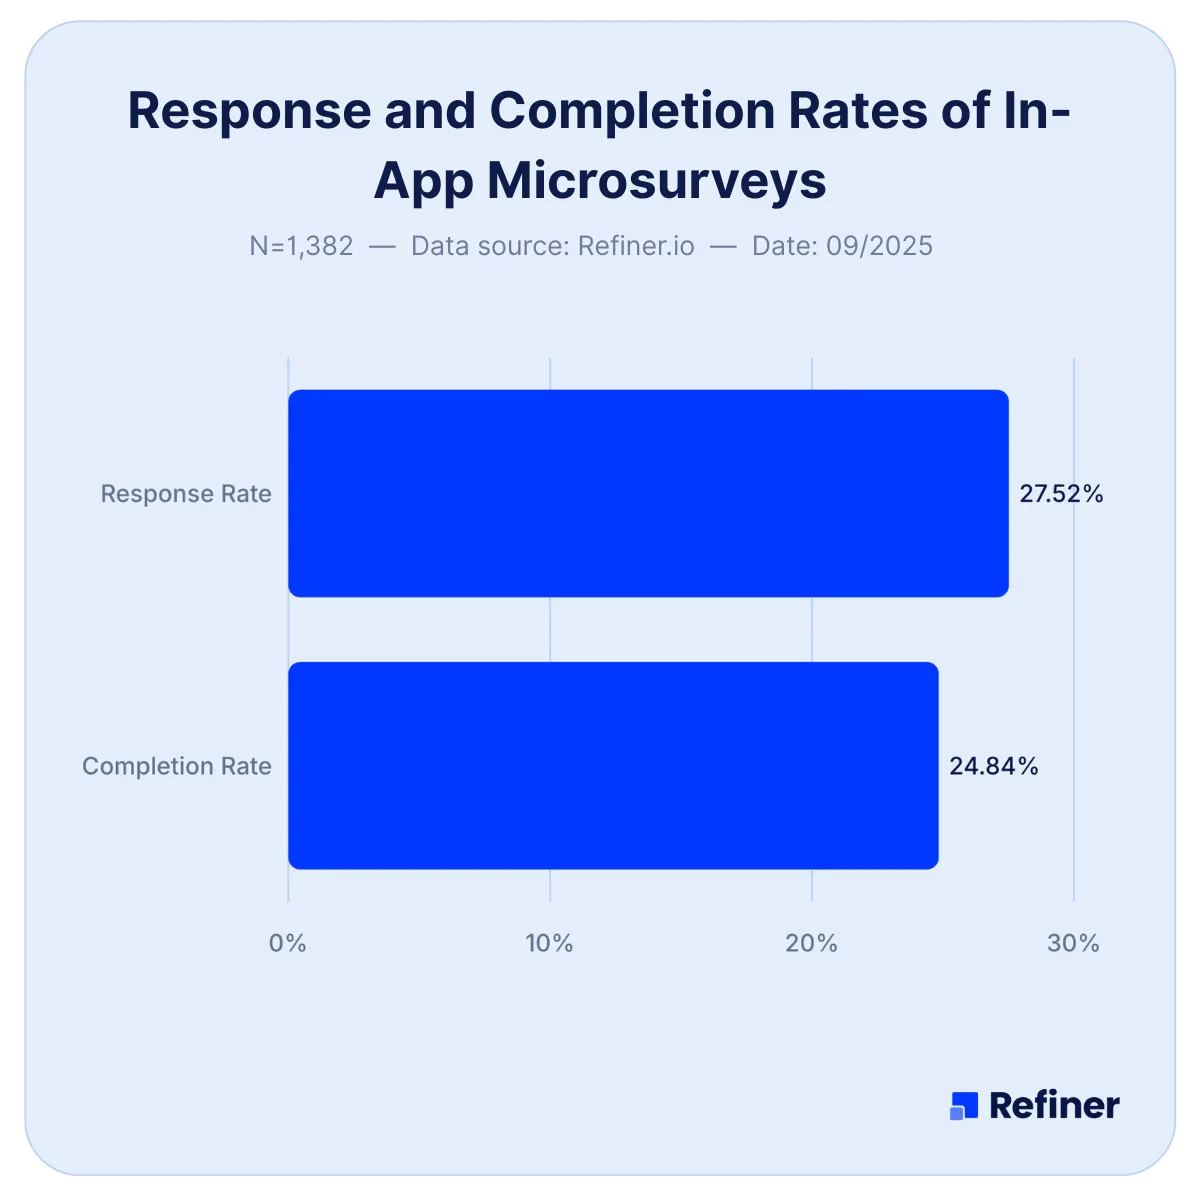
The average in-app survey response rate is 27.52%
In-app surveys get an average response rate of 27.52%, based on 1,382 Refiner surveys with at least 100 views and 50 responses each.
Source: Refiner in-app survey response rate study, 1,382 surveys, 2025.
The average in-app survey completion rate is 24.84%
In-app surveys get an average completion rate of 24.84%, meaning about a quarter of survey views end with every question answered.
Source: Refiner in-app survey response rate study, 1,382 surveys, 2025.
In-app survey response rates went up from 25.25% in 2022 to 27.52% in 2025
The average in-app survey response rate rose from 25.25% in 2022 to 27.52% in 2025, and the average completion rate from 23.04% to 24.84%.
Source: Refiner in-app survey response rate study, 2022 and 2025.
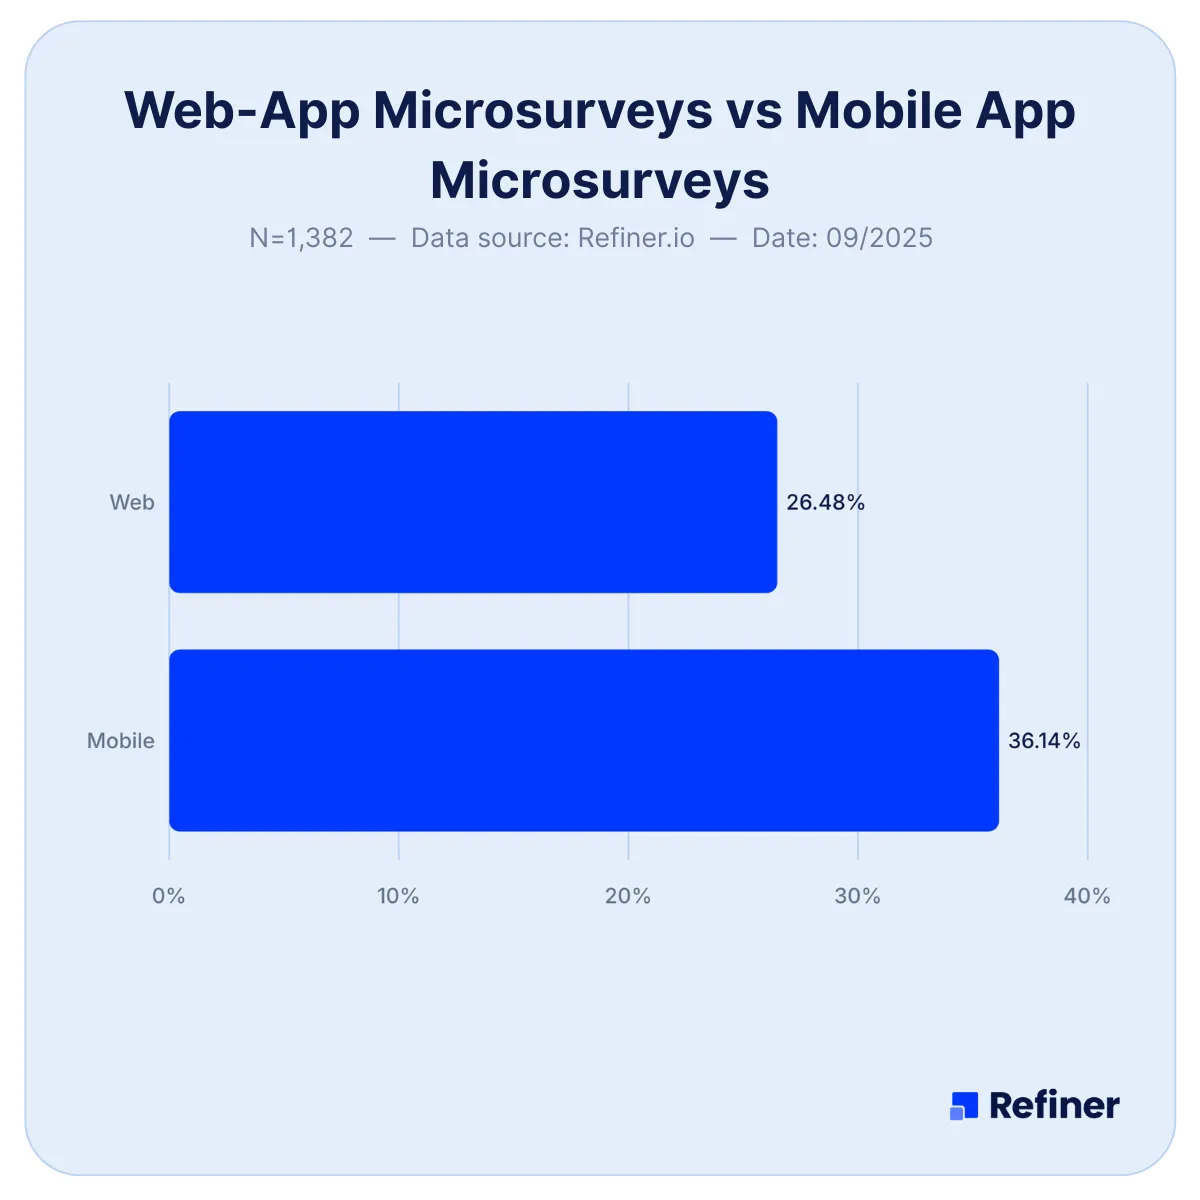
Mobile app surveys get a 36.14% response rate, web app surveys 26.48%
In-app surveys in mobile apps get an average response rate of 36.14%, compared with 26.48% for surveys in web apps.
Source: Refiner in-app survey response rate study, 1,382 surveys, 2025.
In-app survey response rate benchmarks
| Survey | Good | Great | Excellent |
|---|---|---|---|
| Overall | > 15% | > 25% | > 44% |
| NPS | > 14% | > 18% | > 32% |
| CSAT | > 17% | > 25% | > 41% |
| Mobile app | > 19% | > 35% | > 62% |
| Web app | > 15% | > 24% | > 42% |
Source: Refiner in-app survey response rate study, 1,382 surveys, 2025.
Survey length and placement statistics
In-app surveys with 4 to 5 questions get the best response rate
In 2025, in-app surveys with 4 to 5 questions got a higher response rate than any other length, and single-question surveys came second. In 2022, single-question surveys performed best.
Source: Refiner in-app survey response rate study, 1,382 surveys, 2025.
A center modal gets a 42.6% response rate in web apps
Web app surveys shown as a modal in the center of the screen got a 42.6% response rate across 254 surveys. No other web placement with a large sample did better. Top-center surveys got 47.8%, but only 17 surveys used that placement.
Source: Refiner in-app survey response rate study, 2025.
86% of mobile app surveys show at the bottom of the screen
86% of mobile app surveys use a bottom-of-screen placement, with an average response rate of 34.8%. Full-screen modals did better, but only 9 surveys used them.
Source: Refiner in-app survey response rate study, 2025.
NPS statistics
Net Promoter Score (NPS) asks “How likely are you to recommend [Product] to a friend or colleague?” on a 0 to 10 scale. The score is the percentage of promoters (9 to 10) minus the percentage of detractors (0 to 6). More in what is Net Promoter Score.
In-app NPS surveys get a 21.71% response rate
In-app NPS surveys get an average response rate of 21.71% and an average completion rate of 18.74%, based on 283 surveys with 5,091,330 views and 747,099 responses.
Source: Refiner in-app survey response rate study, 283 NPS surveys, 2025.
15% of NPS questions have no follow-up question
15% of NPS questions in live surveys end without a follow-up question. No other metric skips it less often: the average across all rating questions is 19%, and PMF questions skip it 36% of the time.
Source: Refiner follow-up questions study, 5,253 surveys, 2026.
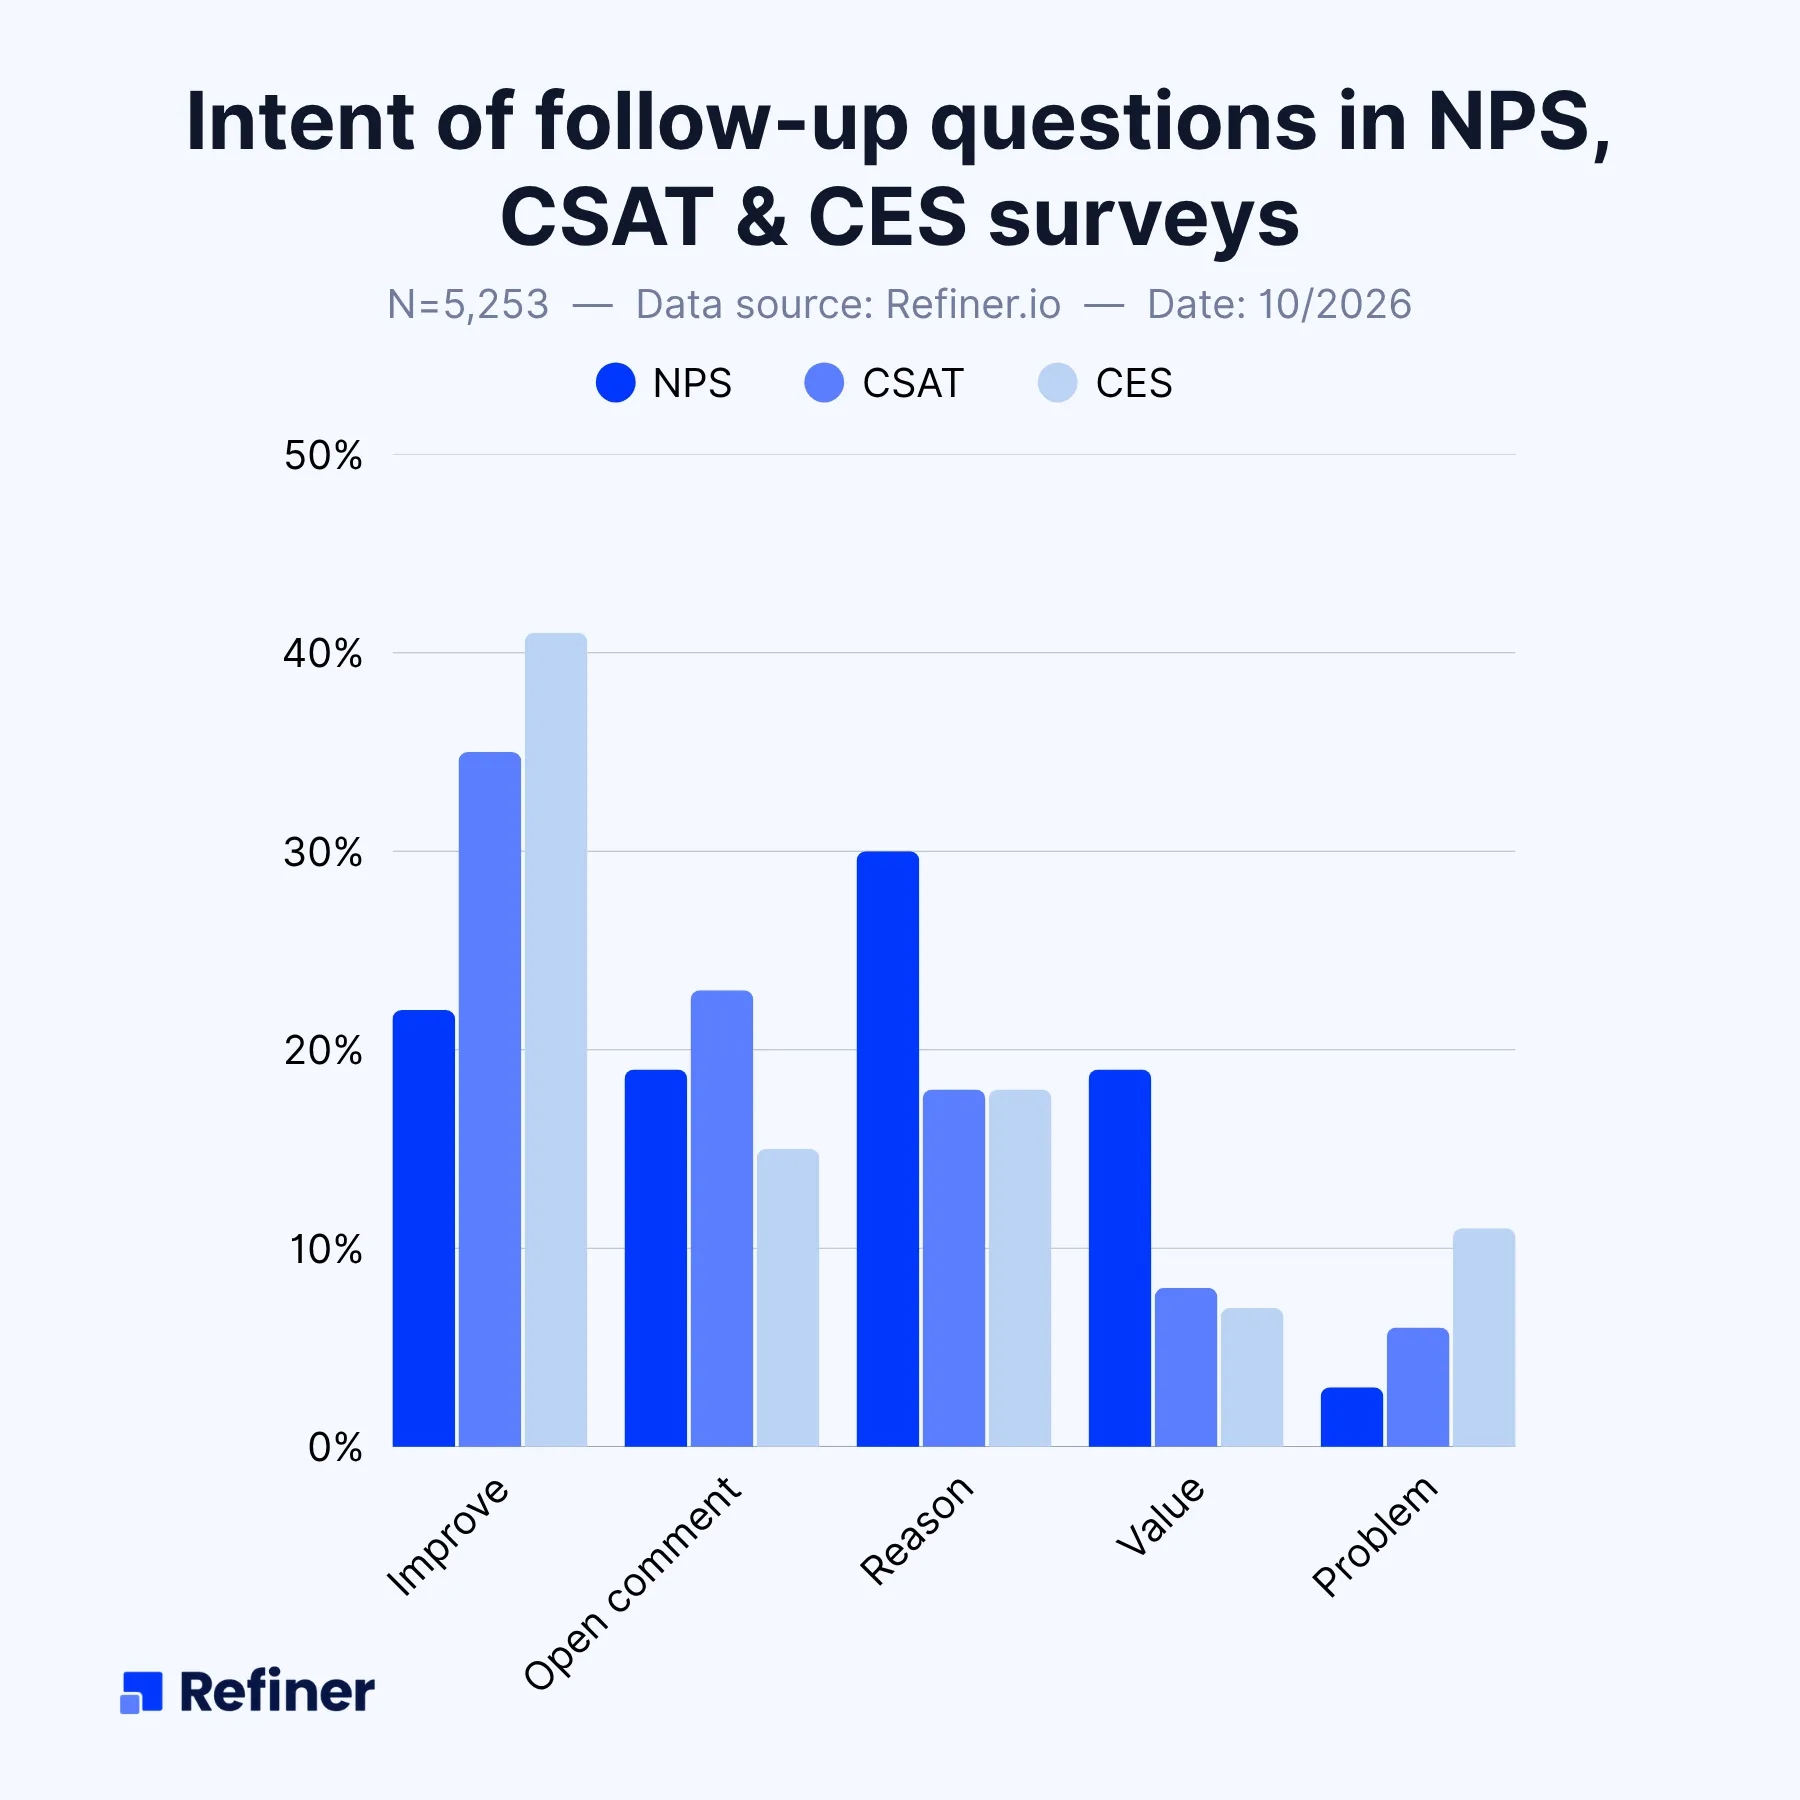
30% of NPS follow-up questions ask for the reason behind the score
“What’s the main reason for your score?” and questions like it make up 30% of unique NPS follow-up questions, and 39% when repeated questions are counted. NPS is the only metric where the reason question comes first.
| NPS follow-up intent | Share of unique questions |
|---|---|
| Reason | 30% |
| Improve | 22% |
| Open comment | 19% |
| Value | 19% |
| Problem | 3% |
Source: Refiner follow-up questions study, 417 unique NPS follow-up questions, 2026.
95% of NPS “what do you value” questions go to every respondent
19% of unique NPS follow-up questions ask what the respondent values about the product, and 95% of those are shown to every respondent, detractors included.
Source: Refiner follow-up questions study, 2026.
9% of NPS follow-up questions name something specific
Only 9% of NPS follow-up questions name a feature, page, or moment. CSAT follow-ups do it 16% of the time and CES follow-ups 29%. NPS asks about the whole relationship, so its follow-ups are the most general.
Source: Refiner follow-up questions study, 2026.
CSAT statistics
Customer satisfaction score (CSAT) asks how satisfied someone is with a product, interaction, or task, usually on a 1 to 5 scale. The score is the percentage of satisfied answers. More in how to calculate CSAT.
In-app CSAT surveys get a 26.29% response rate
In-app CSAT surveys get an average response rate of 26.29% and an average completion rate of 22.73%, based on 259 surveys with 4,575,391 views and 636,278 responses.
Source: Refiner in-app survey response rate study, 259 CSAT surveys, 2025.
26% of CSAT questions have no follow-up question
26% of CSAT questions in live surveys end without a follow-up question, compared with 19% across all rating questions and 15% for NPS.
Source: Refiner follow-up questions study, 5,253 surveys, 2026.
35% of CSAT follow-up questions ask what to improve
The most common CSAT follow-up asks what could be better (35% of unique questions), followed by open comments (23%) and the reason for the rating (18%).
Source: Refiner follow-up questions study, 303 unique CSAT follow-up questions, 2026.
16% of CSAT follow-up questions name the interaction they’re about
Only 16% of CSAT follow-up questions name the ticket, task, or feature the rating was about, even though CSAT surveys usually run after a specific moment.
Source: Refiner follow-up questions study, 2026.
CES statistics
Customer Effort Score (CES) asks how easy it was to do something, like solving an issue or using a feature. More in what is Customer Effort Score.
22% of CES questions have no follow-up question
22% of CES questions in live surveys end without a follow-up question, compared with 19% across all rating questions. For CES, the follow-up matters most after a low score, when it tells you what made the task hard.
Source: Refiner follow-up questions study, 5,253 surveys, 2026.
41% of CES follow-up questions ask what to improve
41% of unique CES follow-up questions ask what could be improved, and 11% ask about problems directly (“What made it difficult?”). CES has the highest share of both intents of any metric.
Source: Refiner follow-up questions study, 103 unique CES follow-up questions, 2026.
29% of CES follow-up questions name something specific
29% of CES follow-up questions name a feature, page, or moment, like “What made creating a report hard?” No other metric does it as often.
Source: Refiner follow-up questions study, 2026.
Product-market fit survey statistics
The product-market fit (PMF) survey asks “How disappointed would you be if you could no longer use [Product]?” The score is the share of “very disappointed” answers, and Sean Ellis’s benchmark for product-market fit is 40%. More in product-market fit questions.
36% of PMF questions have no follow-up question
36% of PMF questions in live surveys end without a follow-up question, almost twice the 19% average across all rating questions. The PMF survey Sean Ellis designed includes follow-ups about the main benefit, the ideal customer, and alternatives.
Source: Refiner follow-up questions study, 5,253 surveys, 2026.
Follow-up question statistics
A follow-up question is the question that comes right after a rating question like NPS, CSAT, or CES. These numbers come from 8,574 rating questions in 5,253 live surveys.
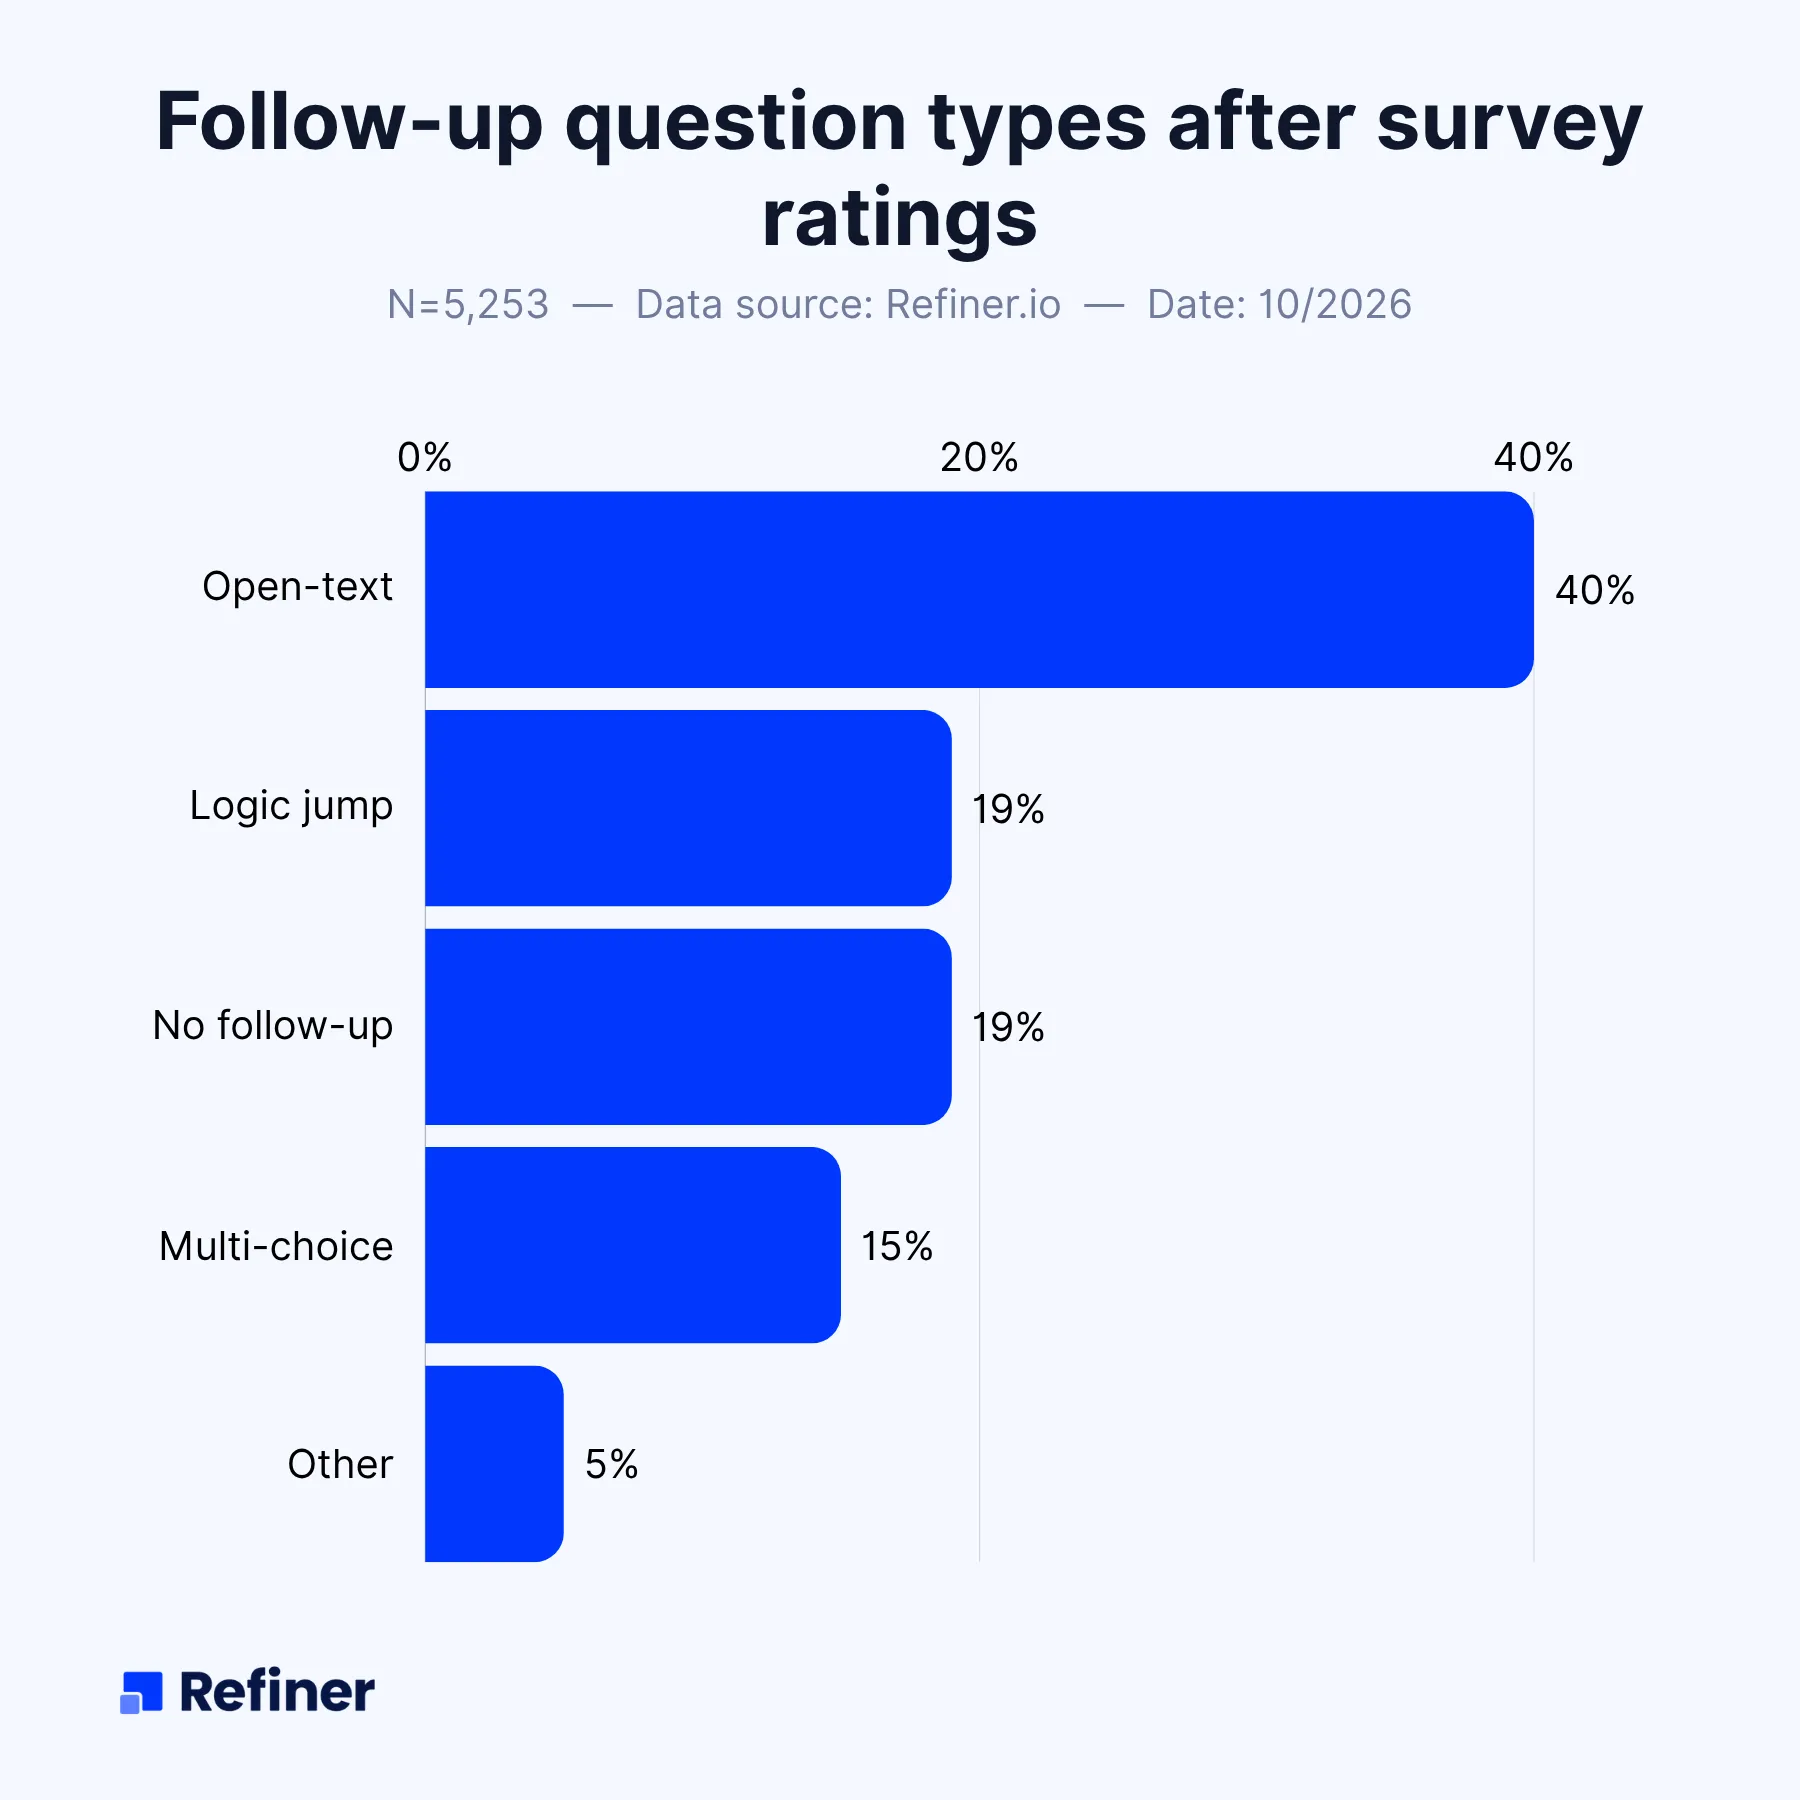
19% of rating questions have no follow-up question
19% of rating questions in live surveys end with a thank-you screen and no follow-up question, so the survey collects a score with no explanation behind it.
Source: Refiner follow-up questions study, 5,253 surveys, 2026.
Bigger survey programs skip the follow-up as often as small ones
The share of rating questions without a follow-up stays between 19% and 20% for surveys with 10 to 99 responses, 100 to 999 responses, and 1,000 or more.
Source: Refiner follow-up questions study, 5,253 surveys, 2026.
Share of rating questions without a follow-up, by metric
| Metric | No follow-up question |
|---|---|
| PMF | 36% |
| CSAT | 26% |
| CES | 22% |
| Other ratings | 19% |
| NPS | 15% |
Source: Refiner follow-up questions study, 5,253 surveys, 2026.
40% of rating questions are followed by an open text question
| What comes after the rating | Share of rating questions |
|---|---|
| Open text question | 40% |
| Nothing (thank-you screen only) | 19% |
| Multiple-choice question | 15% |
| Logic that branches into open text questions | 15% |
| Yes/no, button, or contact form | 5% |
| Logic that branches into multiple choice only | 4% |
Source: Refiner follow-up questions study, 8,574 rating questions, 2026.
27% of follow-up questions ask what to improve
| Follow-up intent | Example | Share of unique questions |
|---|---|---|
| Improve | “What can we do better?” | 27% |
| Open comment | “Anything else you’d like to share?” | 20% |
| Reason | “What’s the main reason for your score?” | 19% |
| Value | “What do you value most about [Product]?” | 14% |
| Problem | “What issues did you run into?” | 6% |
| No question | “Thanks for your feedback!” above a text box | 5% |
| Feature request | “Which features would you like to see added?” | 3% |
| Other | Use case, alternatives, contact, review | 6% |
Source: Refiner follow-up questions study, 2026.
1 in 20 follow-up questions has no question in it
5% of follow-up text boxes show only a message like “Thanks for your feedback!” or “We’re sorry to hear that” with no question, so respondents have to guess what to write.
Source: Refiner follow-up questions study, 2026.
97% of follow-up questions use the same wording for every score
When the follow-up comes straight after the rating, with no logic in between, 97% use wording that fits every score. Only 2% are written for unhappy respondents and 1% for happy ones.
Source: Refiner follow-up questions study, 2026.
15% of rating questions branch into different follow-ups by score
15% of rating questions are followed by survey logic that sends people to different open questions depending on their score.
Source: Refiner follow-up questions study, 2026.
Follow-ups for low scores ask what went wrong, follow-ups for passives ask what would make it a 10
| Follow-up written for | Most common intent | Share | Next most common |
|---|---|---|---|
| Low scores | Problem (“What went wrong?”) | 48% | Reason 24%, improve 15% |
| Passives | Improve (“What would make it a 10?”) | 77% | Reason 21% |
| High scores | Value (“What do you love about it?”) | 41% | Reason 19%, improve 16% |
Source: Refiner follow-up questions study, 2026.
Only 4% of follow-ups for happy respondents ask for a review
Only 4% of follow-up questions written for high scores ask for a review, testimonial, or referral. 17% of high-score follow-ups show only “That’s great to hear!” with no question.
Source: Refiner follow-up questions study, 2026.
Only 4% of “why” follow-up questions name what the score was about
Reason questions like “Why did you give that score?” have a median length of 7 words, and only 4% name a feature, page, or moment. Feature request questions name something specific most often (49%).
Source: Refiner follow-up questions study, 2026.
8% of follow-up questions ask two things at once
8% of follow-up questions ask two things in one question, usually “What did you like and what should we improve?”
Source: Refiner follow-up questions study, 2026.
25% of follow-up questions refer back to the score
25% of follow-up questions mention the score or answer the person just gave, with phrases like “that score” or “your rating.”
Source: Refiner follow-up questions study, 2026.
1.6% of follow-up questions say they’re optional
Only 1.6% of follow-up questions tell respondents the question is optional, and 0.1% use personalization like the person’s first name or plan.
Source: Refiner follow-up questions study, 2026.
40% of follow-up questions aren’t in English
40% of follow-up questions in live Refiner surveys are written in a language other than English. Spanish, French, German, Portuguese, and Thai are the most common.
Source: Refiner follow-up questions study, 35 languages, 2026.
27% of rating questions are followed by another rating
In 27% of cases, a rating question is followed by another rating question, usually a grid of CSAT items like speed, price, and support.
Source: Refiner follow-up questions study, 2026.
Only 10% of multiple-choice follow-ups ask for the reason
When a multiple-choice question follows the rating, only 10% ask for the reason behind the score. 30% ask about a different topic, 26% ask what the person values, and 12% ask a profile question like role or company size.
Source: Refiner follow-up questions study, 2026.
Survey channel statistics
Email surveys ask for the reason in 50% of follow-ups
The follow-up question changes with where the survey runs. Email surveys ask for the reason half the time, while website surveys most often ask “anything else?”
| Channel | Reason | Improve | Open comment | Value |
|---|---|---|---|---|
| 50% | 15% | 14% | 12% | |
| Mobile app | 40% | 24% | 15% | 15% |
| Hosted link | 33% | 13% | 10% | 24% |
| Web app | 28% | 22% | 24% | 16% |
| Website | 19% | 22% | 31% | 7% |
Source: Refiner follow-up questions study, follow-ups that come straight after the rating, 2026.
About the data
In-app survey response rate study (2025)
1,382 in-app surveys created in Refiner, each with at least 100 views and 50 responses. Together they had 50,305,103 views and 6,137,194 responses. A survey view is a survey shown to a user in the app. Full method.
Follow-up questions study (2026)
Every survey created in Refiner from February 2019 to September 2026 (32,236 surveys), filtered to the 5,253 with a rating question and at least 10 responses. Each follow-up question was coded by meaning, in its original language. Intent shares count each unique question once, so one company running hundreds of copies of a survey doesn’t skew the results. Structure numbers (like the share of ratings without a follow-up) count every rating question. The data describes how surveys are set up, not how people answered them. Full method.
I add every new study to this page when it’s published.
How to cite this data
You’re welcome to use any statistic on this page. Cite Refiner and link to the statistic, using its own link (each heading on this page has one) or the study it comes from. For example:
19% of rating questions in live surveys have no follow-up question (Refiner, 5,253 surveys, 2026). Source: https://refiner.io/blog/survey-statistics/#no-follow-up
If you need a cut of the data that isn’t here, or the charts in higher resolution, email contact@refiner.io.
FAQ
What is a good in-app survey response rate?
The average in-app survey response rate is 27.52%, based on 1,382 Refiner surveys in 2025. Mobile app surveys average 36.14% and web app surveys 26.48%. Above 25% overall is a great result, and above 44% is excellent.
What is the average NPS survey response rate?
In-app NPS surveys get a 21.71% response rate and an 18.74% completion rate on average, based on 283 Refiner NPS surveys with 5.1 million views.
What is the average CSAT survey response rate?
In-app CSAT surveys get a 26.29% response rate and a 22.73% completion rate on average, based on 259 Refiner CSAT surveys with 4.6 million views.
How many questions should a survey have?
In Refiner’s 2025 data, in-app surveys with 4 to 5 questions got the best response rate, and single-question surveys came next. In 2022, single-question surveys performed best.
How often do surveys ask a follow-up question after the rating?
81% of the time. In 5,253 live Refiner surveys, 19% of rating questions end without a follow-up question. PMF questions skip it most often (36%) and NPS least often (15%).
Can I use these statistics in my article?
Yes. Cite Refiner and link to this page or to the study the number comes from. Every statistic on this page has its own link you can use.
 What are Microsurveys: Best Practices and Examples
 Mobile App Surveys: Best Practices and 25 Questions to Ask
 What are Product Feedback Surveys (+ 59 Best Questions to Ask)
 How (and Why) You Should Collect In-app Feedback
 How to Collect In-app Feedback: 11 Best Practices
 7 Best In-app Messaging Tools Today
 What are In-app Notifications and Why You Must Be Using Them
 8 In-app Messaging Best Practices for SaaS
 In-app Messaging: The Ultimate Guide
 What is Product Research: A Guide for Founders