
Tags: turn open-text into something you can count
Categorize responses as Feature Request, UX Issue, Pricing, or whatever your team actually cares about. Add tags by hand, with Refiner AI, or from your app. Discover topics you were not tracking yet. Then filter, chart, alert, and digest on them.
Trusted by fast-growing startups and global enterprises
- Qonto
- Razorpay
- BPCE

- Shine
- Copy.ai
- Moqups
- AutoScout24
- Resident Advisor
- Caya
- Livestorm
- Merci app
- OneFootball
Open-text without a taxonomy is just a pile of comments
Rating scores are easy to trend. The why lives in free text, and most teams either read none of it or invent a spreadsheet taxonomy that dies in a month.
Manual tagging does not scale
Fine at 20 responses. At 200, the backlog becomes the analysis.
You only track what you named
New complaints show up as untagged noise until someone notices and writes a tag for them.
Tags that go nowhere
A label on a response is useless if you cannot filter the inbox, slice NPS by topic, or trigger an alert.
One response, several topics
You need multiple tags per response, not a single bucket.
Add tags your way
A response can carry several tags. Manual when a human should decide. Auto when you already know the topic. Programmatic when the category exists upstream.
Manual tagging
"+ Tag response" on any reply. Use it for an important customer, a miss by auto-tag, or extra context only a person can add.
Auto tagging
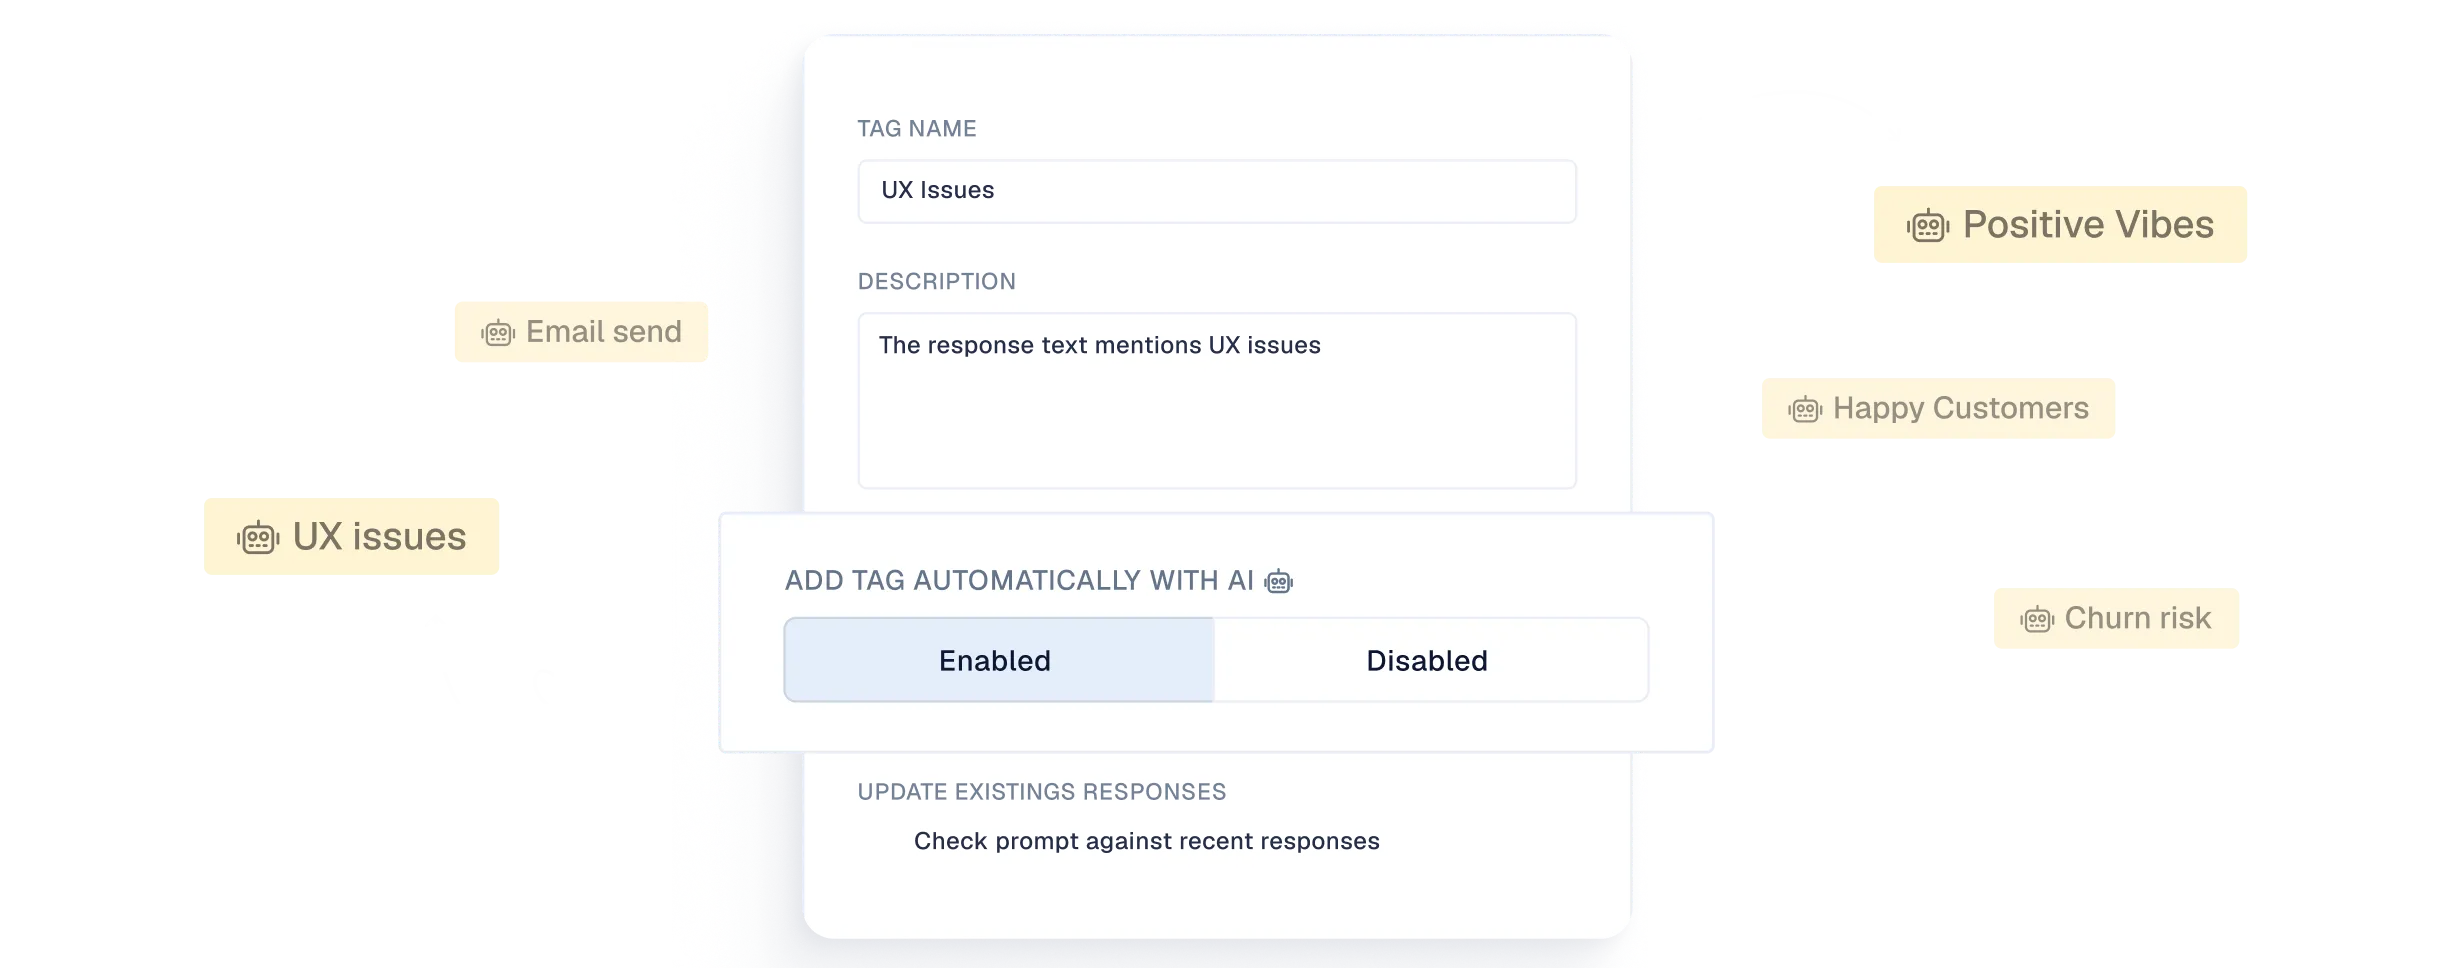
Write a plain-language description. Tone, UX issues, feature requests, support problems, even "NPS is 9 or 10". AI applies the tag when it matches.
Check recent responses
When you save an auto tag, run it against your latest replies immediately. See if it is too broad or too narrow before you wait for new traffic.
Programmatic tagging
Use a function in the SDK for in-app surveys, email embed code, or survey-page URL params.
See which topics are moving
Scan what showed up in the last 24 hours, 7 days, or all time.
Trending first
See topics gaining attention, not a dead alphabetical list.
Sort by volume
Switch to response count when you care about the biggest pile, not the newest spike.
Time windows
Last 24 hours, last 7 days, or all time. Same library, different zoom.
Then open the list
From a tag, jump to the underlying responses. Combine with survey or segment filters. Then save the view.
Discover tags you were not looking for
Auto-tagging tracks topics you defined. Tag Discovery reads recent responses and the surveys you created, then suggests tags you may not have thought to track.
Suggestions from live feedback
Recurring product issues, feature requests, concerns, emerging themes.
Accept or dismiss
Accepted tags join the library and can auto-apply to matching new responses.
Automatic and on demand
Discovery runs on a schedule as new feedback comes in.
Known plus unknown
Auto-tagging files into the taxonomy you wrote. Discovery proposes the one your users are inventing.
Analyze and act on tags
Once a tag is on a response, it is a filter for charts, alert triggers, and digest metrics.
Filter responses
One tag or several, plus survey, segment, or score. Then save the view.
Tag overview
See which topics show up most in the selected surveys and date range.
Tags trend
Watch a topic rise or fall after a launch, an incident, or an onboarding change.
Filter other charts by tag
NPS for Pricing Issue. CSAT for Support Problem. Then alert on a tag, or put tag counts in a digest.
Start tagging the feedback you already have
Define a few tags, turn on auto tagging, backfill recent responses, and let discovery suggest the rest. Then put those tags on a chart, an alert, and a weekly digest.

Super easy two-way integration with Segment and great support in setting up and launching our in-app surveys made it a success!
— Coralie Blanc, CRM Lead @ Qonto