Tag Analysis
Tags turn qualitative survey feedback into data that you can filter, compare, and track over time.
Refiner lets you analyze Tags in two main ways: filter your response lists to inspect the underlying feedback, or visualize Tag activity in your Dashboards.
Explore your Tags
The first place where you can make sense of your tagged survey responses is the Tags page.
It gives you a quick overview of which Tags were added to responses during the last 24 hours, last 7 days or All Time.
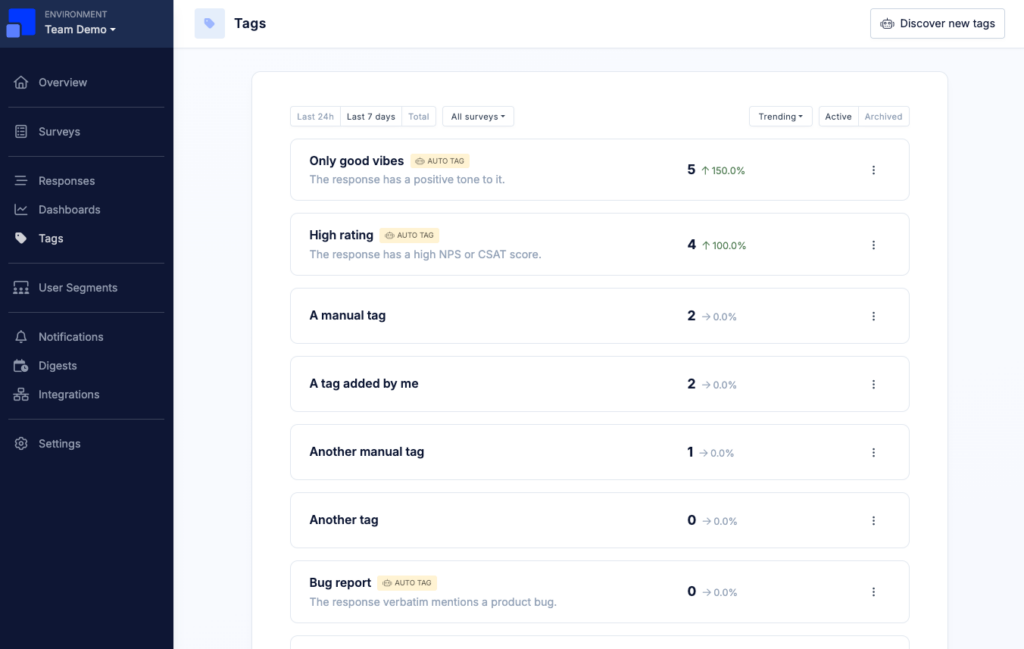
By default, Tags are ordered by Trending, making it easy to spot topics that are currently gaining attention.
You can also sort Tags alphabetically or by the number of responses carrying each Tag.
Filter responses by Tag
The Responses page lets you filter survey responses by one or more Tags.
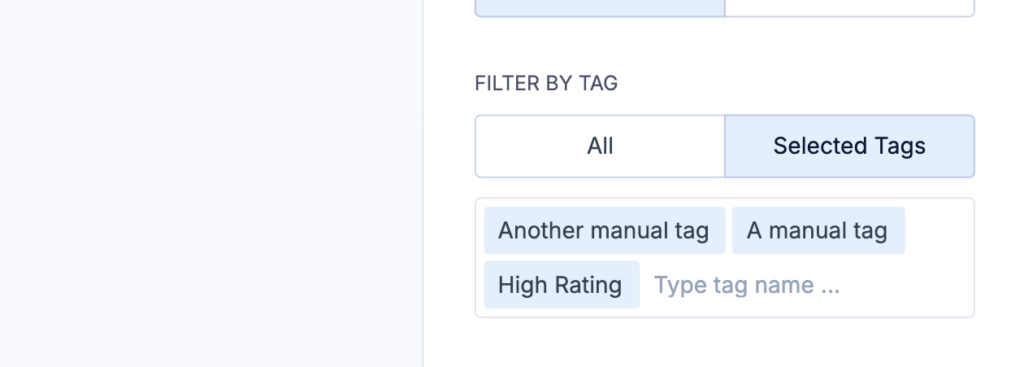
This is useful when you want to inspect all feedback related to a particular topic, such as:
- Feature requests
- UX issues
- Pricing feedback
- Positive feedback
- Support problems
Tag filters can be combined with other filters to narrow down the results further.
For example, you might want to look at responses tagged Feature Request from a specific survey, or responses tagged UX Issue from a particular customer segment.
You can save frequently used filter combinations as Response Lists, giving you quick access to the same group of responses later.
See Response Lists to learn more about filtering and saving survey responses.
Visualize Tags in Dashboards
You can use Tags in Refiner Dashboards to get a higher-level view of the topics appearing in your survey feedback.
Two chart types are specifically designed for Tags.
Tag Overview
The Tag Overview chart shows how frequently different Tags occur within the selected survey data and date range.
This makes it easy to identify the most common topics, issues, requests, or sentiments in your feedback.
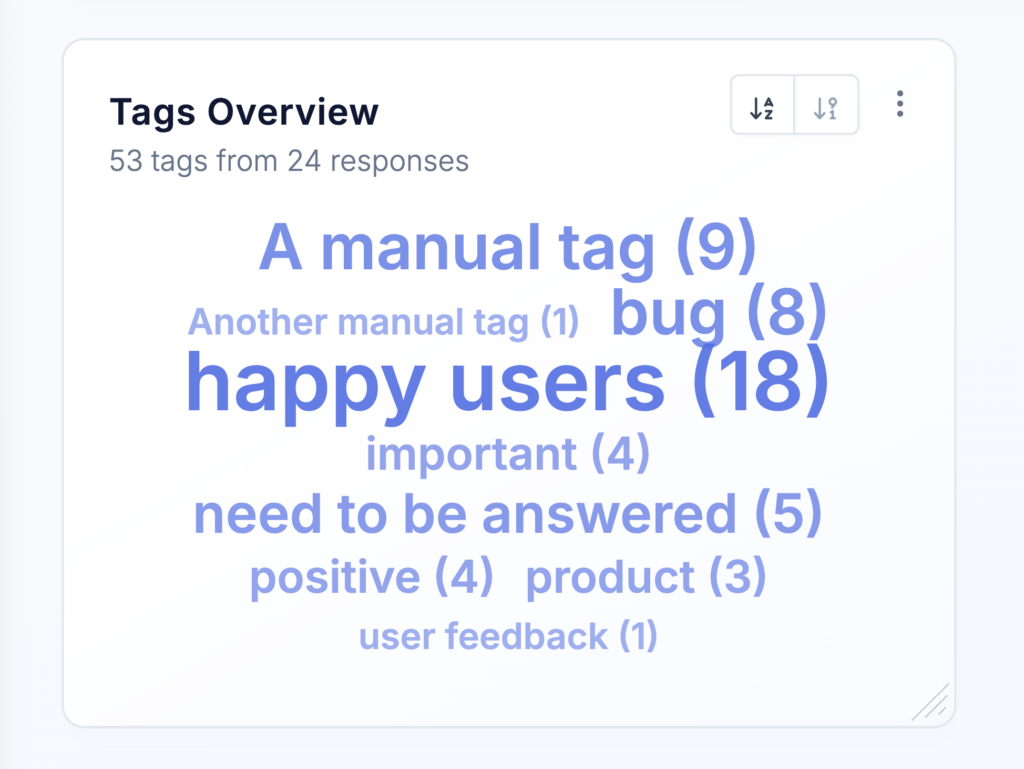
For example, if you use Auto Tagging to categorize open-text feedback, a Tag Overview can quickly show which topics are being mentioned most frequently.
Tags Trend Chart
The Tags Trend Chart chart shows how often selected Tags appear over time.
This helps you identify whether certain topics are becoming more or less frequent.
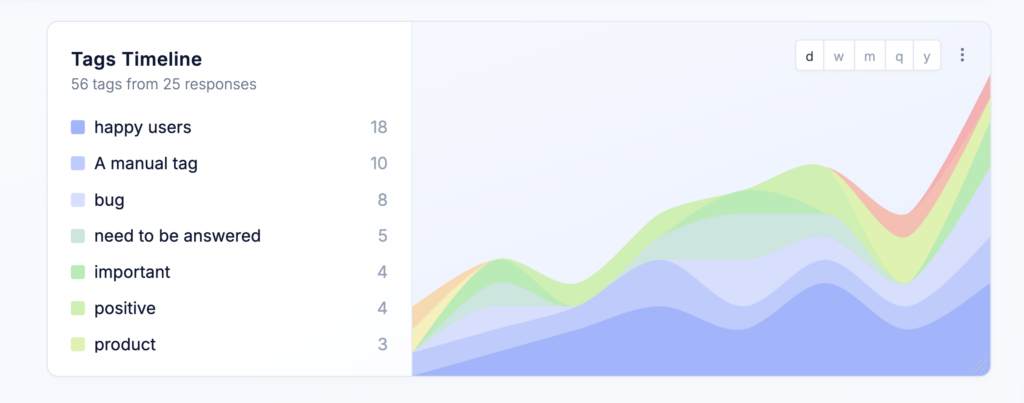
For example, you could use a Tags Timeline to monitor:
- An increase in reports of a product issue
- Changes in feature requests over time
- Feedback after a product launch
- Changes in customer sentiment
- The impact of improvements to onboarding or support
See Tags Timeline for more information about this chart type.
Filter Dashboard data by Tag
Tags can also be used as filters for other Dashboard charts.
For example, you might want to look at:
- NPS for responses tagged Pricing Issue
- CSAT for responses tagged Support Problem
- Rating averages for responses mentioning a particular feature
- Response distributions for a specific feedback topic
You can apply Tag filters using the Dashboard’s global filter sidebar or configure filters for individual charts.
Tag filters can also be combined with other filters, such as surveys, user segments, response data, or contact data.
See Dashboard Data Filters and Chart Options for more information.
From trends to individual responses
A useful workflow is to first use Dashboard charts to identify an interesting Tag or trend and then filter your Response List by that Tag to inspect the individual responses behind it.
This allows you to move from a high-level view of your feedback to the actual comments and customers behind the numbers.
Act on tagged feedback
Tags can also be used outside of reporting.
For example, you can create a Notification that sends an Email, Slack, or Teams message whenever a specific Tag is added to a response.
This can be useful for immediately routing feedback to the right team. For example, responses tagged Bug Report could notify your product team, while responses tagged Support Issue could be sent to customer support.
You can also include Tag Counts in scheduled Digests to keep your team informed about important feedback topics over time.
See Notifications and Scheduled Digests to learn more.