Distribution Trend Chart
The Distribution Trend Chart helps you visualize how survey response data changes over time. Instead of showing a single metric, it displays the distribution of responses as colored areas across a timeline.
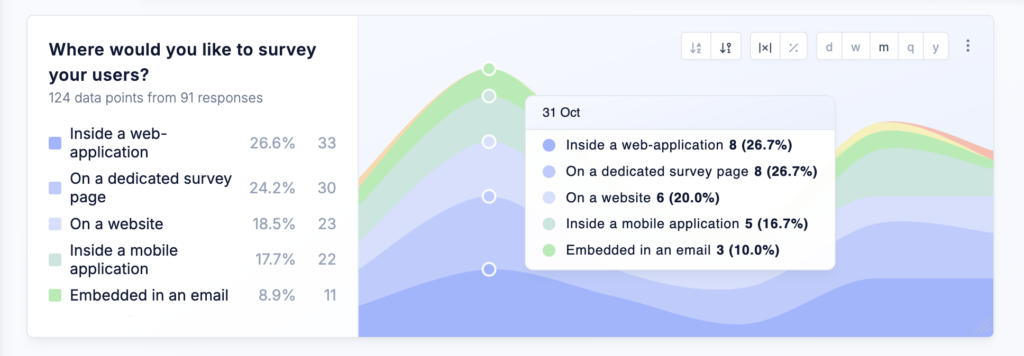
Each color represents a response segment (such as NPS groups or answer options), and its size reflects its count or share within a given time period. As these areas shift, you can quickly see how user sentiment evolves.
You can group data by day, week, month, quarter, or year, depending on the level of detail you need. This makes it easy to analyze both short-term changes and long-term trends.
You can also choose if you the timeline chart should show the total count or the percentage share of each response segment.
The chart is especially useful for understanding what drives changes in your data. For example, it can reveal whether an improvement in scores comes from more positive responses, fewer negative ones, or both.