Customer Satisfaction (CSAT)
What is a CSAT score?
CSAT questions are a popular survey type used to measure how satisfied respondents are with your product, service, or overall experience.
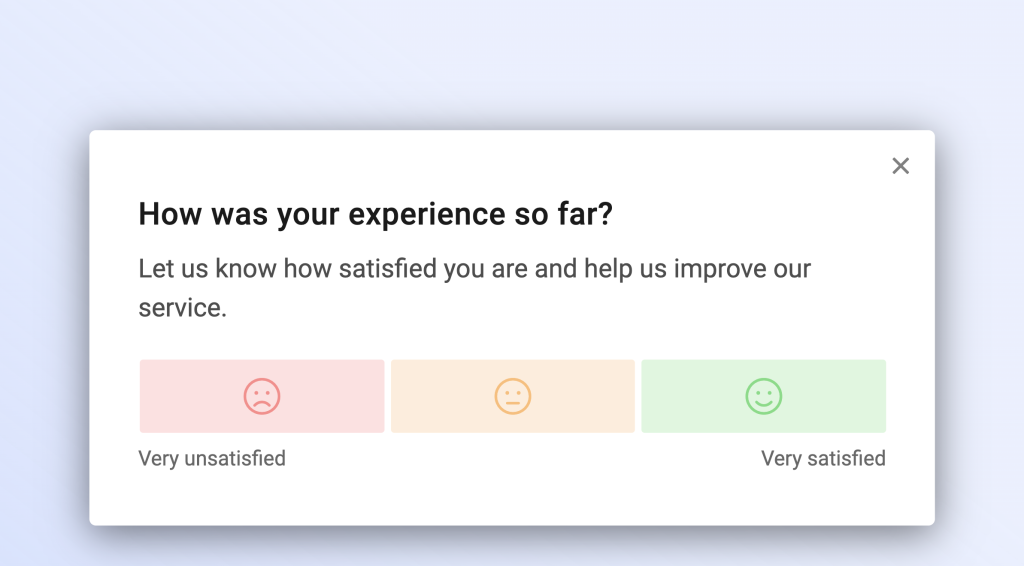
The CSAT question asks a user to rate an experience by providing a negativ, neutral or positive score.
The CSAT score is then calculated by dividing the number of positive answers by the number of negative answers.
CSAT Score = (Number of Satisfied Customers ÷ Total Responses) × 100
We’ve published a detailed article about CSAT surveys on our blog, explaining how CSAT works and how the score is calculated.
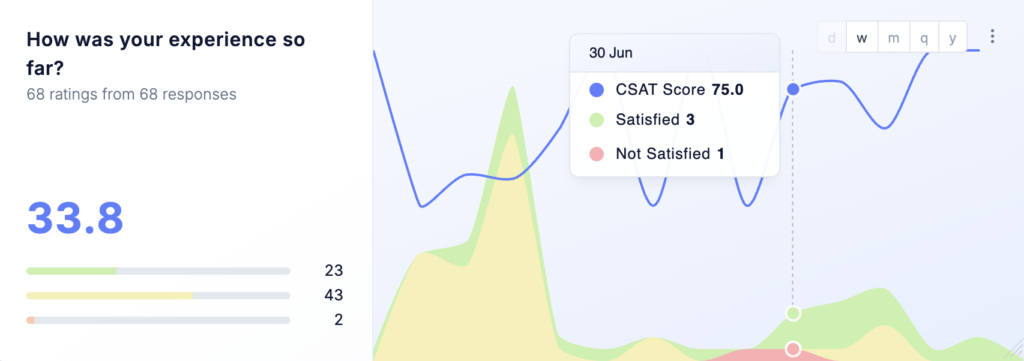
Responses to CSAT question can be visualized in Refiner with the CSAT Timeline chart.
Customize CSAT question
CSAT scale type
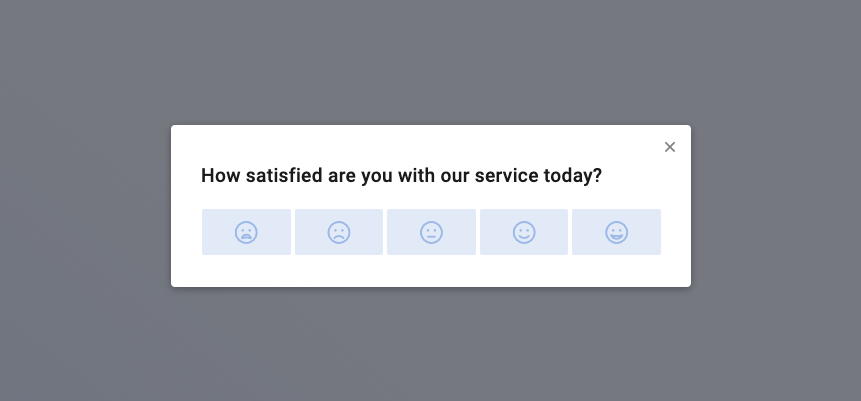
CSAT questions can be set to a two, three, four or five-points scale. You can access this option by clicking on “Show advanced options” in the survey question editor.
When using a five-point scale, you’ll get a higher granularity for each individual response. The three-point scale has the advantage that it provides less visual complexity. The two- and four-points scale do not have a neutral response option. The scale you choose doesn’t affect the way the CSAT score is calculated.
You can also choose to switch to a two-points scale which will then hide the “neutral” option.
CSAT response values
The response values stored in your Refiner are either negative, zero or positive integer values. Storing values in this way allows an easy calculation of the CSAT score.
| -2 | Very negativ – Only available for five-point scale |
| -1 | Negativ |
| 0 | Neutral |
| 1 | Positive |
| 2 | Very positive – Only available for five-point scale |
If you are looking to capture ratings consisting of only positive numbers (e.g. 1-5, 1-7, ..), we recommend using our generic Star & Numeric Rating question type.
Multicolor CSAT scale
CSAT questions can have a plain or multicolor scale. You can toggle between the two modes by clicking on “Show advanced options” in the bottom of the survey question editor.
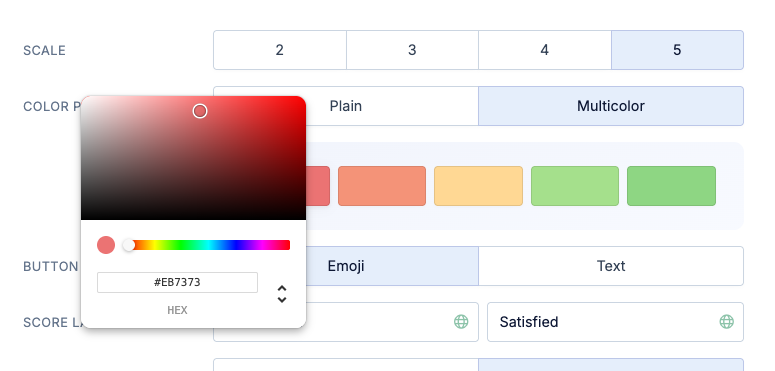
The multicolor mode give you the option to customize the colors for negative, neutral and positive ratings. We recommend to use standard colors such as red, orange and green, to provide clear guidance to respondents.
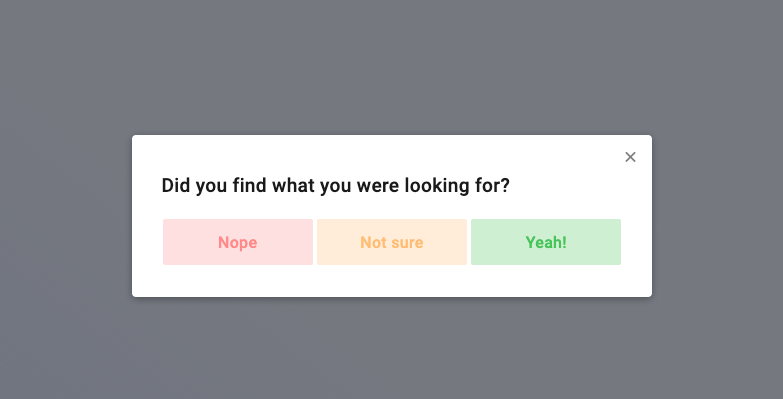
Emoji or Text Buttons
By default, CSAT questions use Emojis to visualize the satisfaction level. You can choose to switch to a text representation to make the buttons more explicit.
Visualizing CSAT results
CSAT results are presented in Refiner with clear, customizable CSAT Timeline Chart.
The CSAT Timeline Chart is automatically added to the ad-hoc dashboard of your survey. You can also add CSAT Timeline Charts to any of your custom dashboards. As with all other dashboard charts, you can filter responses by user segment, survey and tags.
Other ways to use CSAT in Refiner
In addition to visualizing CSAT response data in the CSAT Timeline Chart as described above, you can also:
- Segment CSAT results by user attributes (e.g., subscription plan, region, or lifecycle stage).
- User Logic-Jumps to ask dynamic follow-up questions to uncover the reasons behind a rating.
- Send team alerts based on CSAT scores
- Trigger integrations and automated workflows based on CSAT scores