Net Promoter Score (NPS)
What is NPS?
The Net Promoter Score (NPS) is a widely recognized metric used to measure customer loyalty and gauge how likely your customers are to recommend your product or service to others.
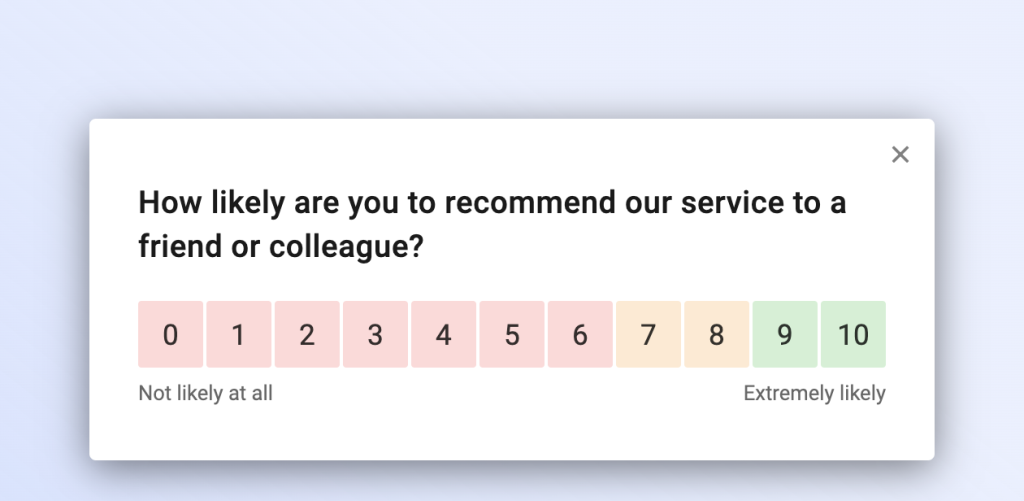
In an NPS survey, respondents answer a single, standardized question:
On a scale of 0 to 10, how likely are you to recommend our service to a friend or colleague?
If you want to learn everything there is to know about NPS, we’ve published a detailed NPS guide on our blog.
In Refiner, you can add an NPS question to any survey and access detailed visualizations of the results, making it an ideal NPS survey solution for SaaS businesses and mobile apps.
How NPS is calculated
Respondents are then grouped into three groups:
- Detractors (0–6) – Customers who are unlikely to recommend your service and may even discourage others from using it.
- Passives (7–8) – Customers who are satisfied but not enthusiastic enough to actively promote your brand.
- Promoters (9–10) – Loyal customers who are highly likely to recommend your service and contribute to positive word-of-mouth.
The Net Promoters Score is calculated. by subtracting the percentage of Detractors from the percentage of Promoters:
NPS = % Promoters – % Detractors
The resulting score ranges from -100 (all Detractors) to +100 (all Promoters).
Customize NPS question
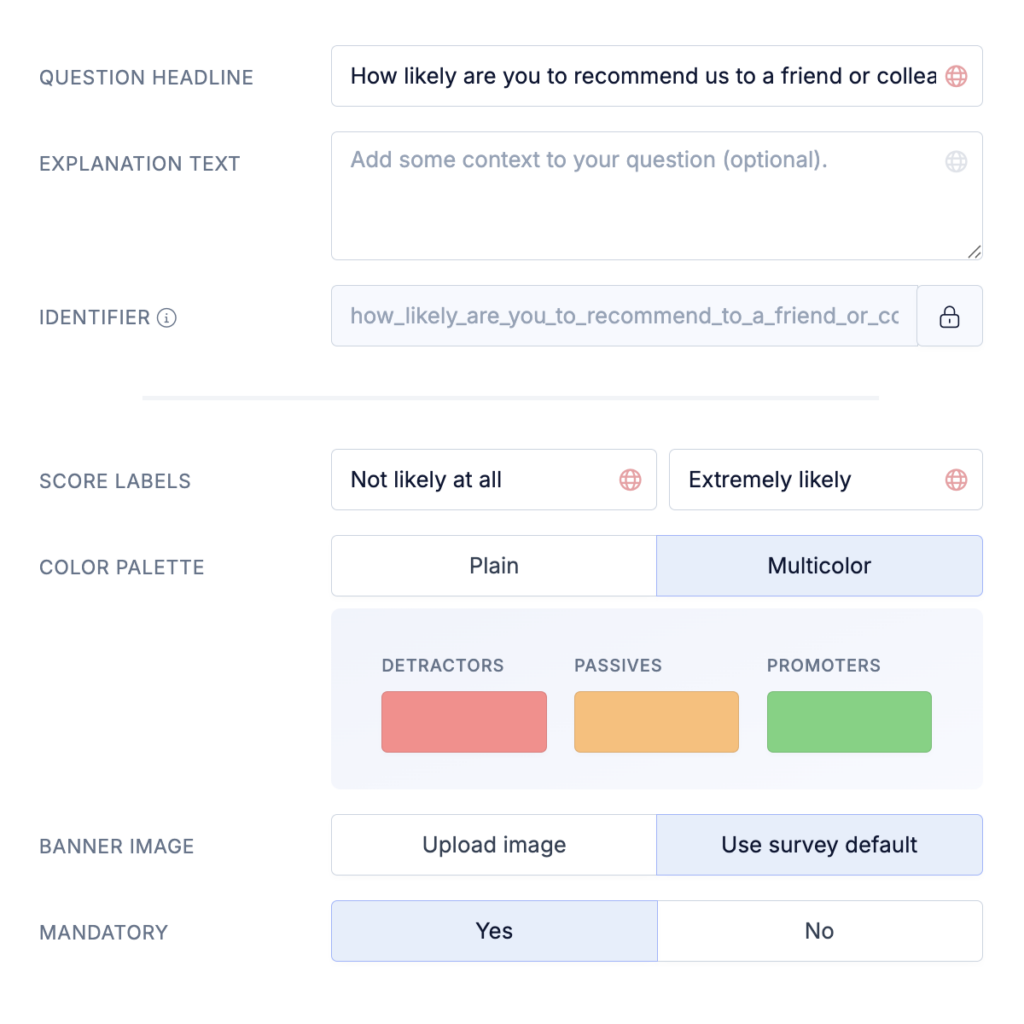
As mentioned above, the NPS methodology is based on a standardized question. However, as with all survey questions in Refiner, you have full control over the wording and customization options.
You can adjust the question text, add contextual information, customize the color palette and scale labels, include a banner image, and choose whether the question is required or optional.
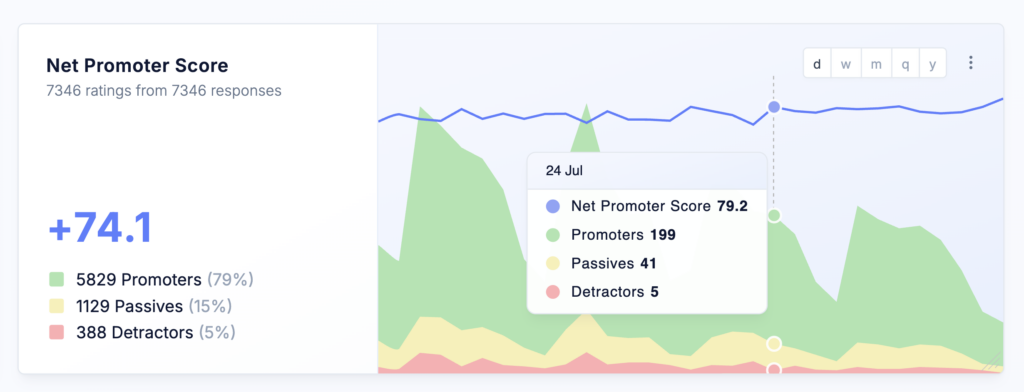
Visualizing NPS results
NPS results are presented in Refiner with clear, customizable NPS Timeline Chart.
The NPS Timeline Chart is automatically added to the ad-hoc dashboard of your survey. You can also add NPS Timeline Charts to any of your custom dashboards. As with all other dashboard charts, you can filter responses by user segment, survey and tags.
Other ways to use NPS in Refiner
In addition to visualizing NPS response data in the NPS Timeline Chart as described above, you can also
- Segment NPS results by user attributes (e.g., subscription plan, region, or lifecycle stage).
- User Logic-Jumps to ask personalized follow-up questions to uncover the reasons behind a rating.
- Send team alerts based on NPS scores
- Trigger integrations and automated workflows based on NPS scores